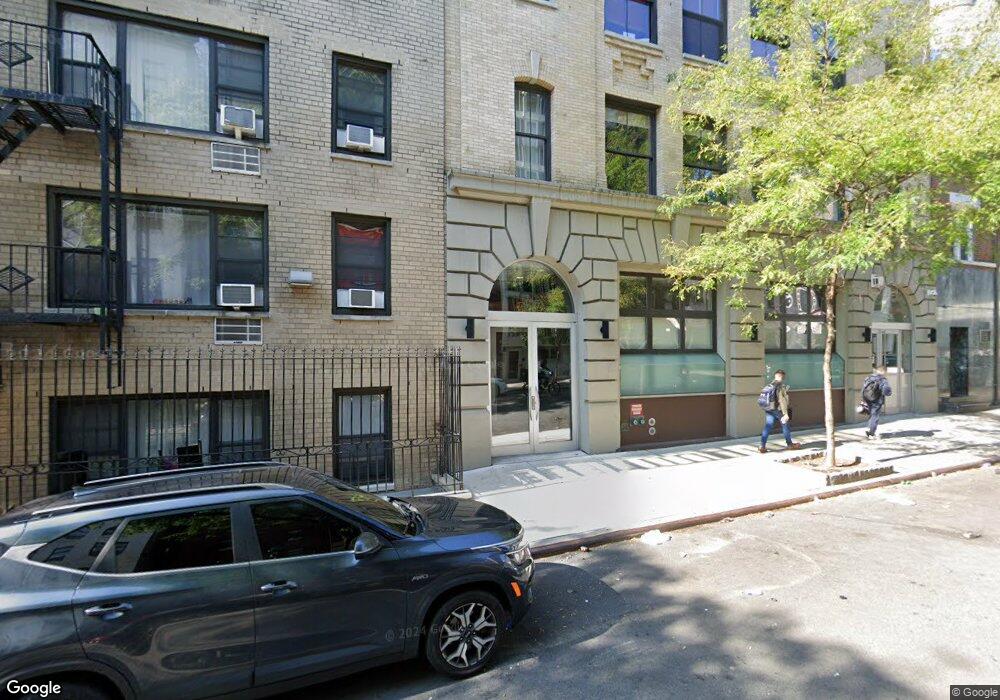
406 W 45th St Unit 4B408 New York, NY 10036
Hell's Kitchen NeighborhoodEstimated Value: $856,000 - $1,303,000
--
Bed
--
Bath
1,042
Sq Ft
$1,124/Sq Ft
Est. Value
About This Home
This home is located at 406 W 45th St Unit 4B408, New York, NY 10036 and is currently estimated at $1,170,871, approximately $1,123 per square foot. 406 W 45th St Unit 4B408 is a home located in New York County with nearby schools including P.S. 51 Elias Howe, Clinton School, and Middle School 297.
Ownership History
Date
Name
Owned For
Owner Type
Purchase Details
Closed on
Sep 28, 2023
Sold by
Ogisu Fukiko
Bought by
Zhan Minjia
Current Estimated Value
Purchase Details
Closed on
Aug 11, 2009
Sold by
Booz David and Judge Joshua
Bought by
Ogisu Fukiko
Home Financials for this Owner
Home Financials are based on the most recent Mortgage that was taken out on this home.
Original Mortgage
$843,750
Interest Rate
5.17%
Mortgage Type
Purchase Money Mortgage
Purchase Details
Closed on
Sep 27, 2007
Sold by
406-408 West 45Th Street Holdings Llc and % Gramercy Property Group Llc
Bought by
Booz David and Booz Joshua Judge
Home Financials for this Owner
Home Financials are based on the most recent Mortgage that was taken out on this home.
Original Mortgage
$860,000
Interest Rate
6.49%
Mortgage Type
Purchase Money Mortgage
Create a Home Valuation Report for This Property
The Home Valuation Report is an in-depth analysis detailing your home's value as well as a comparison with similar homes in the area
Home Values in the Area
Average Home Value in this Area
Purchase History
| Date | Buyer | Sale Price | Title Company |
|---|---|---|---|
| Zhan Minjia | $1,220,000 | -- | |
| Ogisu Fukiko | $1,125,000 | -- | |
| Ogisu Fukiko | $1,125,000 | -- | |
| Booz David | $1,075,000 | -- | |
| Booz David | $1,075,000 | -- |
Source: Public Records
Mortgage History
| Date | Status | Borrower | Loan Amount |
|---|---|---|---|
| Previous Owner | Ogisu Fukiko | $843,750 | |
| Previous Owner | Booz David | $860,000 |
Source: Public Records
Tax History Compared to Growth
Tax History
| Year | Tax Paid | Tax Assessment Tax Assessment Total Assessment is a certain percentage of the fair market value that is determined by local assessors to be the total taxable value of land and additions on the property. | Land | Improvement |
|---|---|---|---|---|
| 2025 | $17,513 | $140,699 | $19,667 | $121,032 |
| 2024 | $17,513 | $140,085 | $19,667 | $120,418 |
| 2023 | $17,155 | $139,847 | $19,667 | $120,180 |
| 2022 | $16,882 | $140,428 | $19,667 | $120,761 |
| 2021 | $16,462 | $134,199 | $19,667 | $114,532 |
| 2020 | $13,352 | $150,302 | $19,667 | $130,635 |
| 2019 | $13,019 | $140,949 | $19,667 | $121,282 |
| 2018 | $14,872 | $145,676 | $19,667 | $126,009 |
| 2017 | $13,568 | $123,263 | $19,668 | $103,595 |
| 2016 | $12,869 | $110,223 | $19,667 | $90,556 |
| 2015 | $7,348 | $105,516 | $19,667 | $85,849 |
| 2014 | $7,348 | $99,968 | $19,667 | $80,301 |
Source: Public Records
Map
Nearby Homes
- 411 W 44th St Unit 13
- 406 W 46th St Unit 2-C
- 406 W 46th St Unit 3B
- 349 W 44th St Unit 2-RE
- 422 W 46th St Unit 2R
- 350 W 44th St Unit 505
- 350 W 44th St Unit 704
- 350 W 44th St Unit 204
- 350 W 44th St Unit 101
- 350 W 44th St Unit 603
- 350 W 44th St Unit 604
- 350 W 44th St Unit 205
- 428 W 44th St
- 430 W 46th St Unit 5-E
- 433 W 46th St Unit 1RW
- 325 W 45th St Unit 701
- 325 W 45th St Unit 319
- 325 W 45th St Unit 108
- 325 W 45th St Unit 819
- 325 W 45th St Unit 312
- 406 W 45th St Unit 3 A
- 406 W 45th St Unit 408
- 406 W 45th St Unit 408
- 406 W 45th St Unit 5D408
- 406 W 45th St Unit 5C408
- 406 W 45th St Unit 5B408
- 406 W 45th St Unit 5A408
- 406 W 45th St Unit 4D408
- 406 W 45th St Unit 4C408
- 406 W 45th St Unit 4A408
- 406 W 45th St Unit 3D408
- 406 W 45th St Unit 3C408
- 406 W 45th St Unit 3B408
- 406 W 45th St Unit 3A408
- 406 W 45th St Unit 2D408
- 406 W 45th St Unit 2C408
- 406 W 45th St Unit 2B408
- 406 W 45th St Unit 2A408
- 406 W 45th St Unit 1C408
- 406 W 45th St Unit 1B408