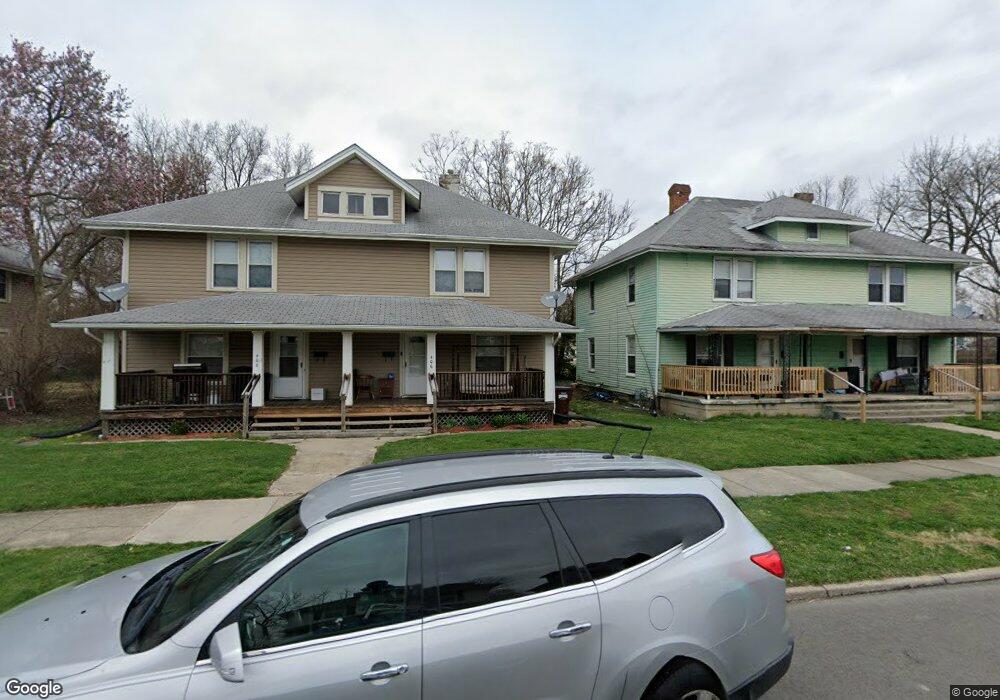
406 W Euclid Ave Unit 408 Springfield, OH 45506
Estimated Value: $100,983 - $142,000
4
Beds
2
Baths
2,822
Sq Ft
$43/Sq Ft
Est. Value
About This Home
This home is located at 406 W Euclid Ave Unit 408, Springfield, OH 45506 and is currently estimated at $120,246, approximately $42 per square foot. 406 W Euclid Ave Unit 408 is a home located in Clark County with nearby schools including Fulton Elementary School, Hayward Middle School, and Springfield High School.
Ownership History
Date
Name
Owned For
Owner Type
Purchase Details
Closed on
Jun 5, 2024
Sold by
Aim High Properties Llc
Bought by
Augustin Jeanty J and Prospere Schedeline
Current Estimated Value
Home Financials for this Owner
Home Financials are based on the most recent Mortgage that was taken out on this home.
Original Mortgage
$92,587
Outstanding Balance
$91,439
Interest Rate
7.17%
Mortgage Type
New Conventional
Estimated Equity
$28,807
Purchase Details
Closed on
Oct 4, 2021
Sold by
Trimble James D
Bought by
Aim High Properties Llc
Purchase Details
Closed on
Jan 30, 2004
Sold by
Bauer John M and Bauer Brenda D
Bought by
Trimble James D
Home Financials for this Owner
Home Financials are based on the most recent Mortgage that was taken out on this home.
Original Mortgage
$49,500
Interest Rate
7.55%
Mortgage Type
Purchase Money Mortgage
Purchase Details
Closed on
Aug 24, 1992
Create a Home Valuation Report for This Property
The Home Valuation Report is an in-depth analysis detailing your home's value as well as a comparison with similar homes in the area
Home Values in the Area
Average Home Value in this Area
Purchase History
| Date | Buyer | Sale Price | Title Company |
|---|---|---|---|
| Augustin Jeanty J | $123,500 | Chicago Title | |
| Aim High Properties Llc | $50,500 | Axxis Title Agency Ltd | |
| Trimble James D | $55,000 | -- | |
| -- | $20,000 | -- |
Source: Public Records
Mortgage History
| Date | Status | Borrower | Loan Amount |
|---|---|---|---|
| Open | Augustin Jeanty J | $92,587 | |
| Previous Owner | Trimble James D | $49,500 |
Source: Public Records
Tax History Compared to Growth
Tax History
| Year | Tax Paid | Tax Assessment Tax Assessment Total Assessment is a certain percentage of the fair market value that is determined by local assessors to be the total taxable value of land and additions on the property. | Land | Improvement |
|---|---|---|---|---|
| 2024 | $1,250 | $25,310 | $1,790 | $23,520 |
| 2023 | $1,250 | $25,310 | $1,790 | $23,520 |
| 2022 | $1,281 | $25,310 | $1,790 | $23,520 |
| 2021 | $1,119 | $20,920 | $1,480 | $19,440 |
| 2020 | $1,121 | $20,920 | $1,480 | $19,440 |
| 2019 | $1,124 | $20,920 | $1,480 | $19,440 |
| 2018 | $994 | $17,770 | $1,270 | $16,500 |
| 2017 | $993 | $17,770 | $1,271 | $16,499 |
| 2016 | $994 | $17,770 | $1,271 | $16,499 |
| 2015 | $1,014 | $17,770 | $1,271 | $16,499 |
| 2014 | $1,010 | $17,770 | $1,271 | $16,499 |
| 2013 | $999 | $17,770 | $1,271 | $16,499 |
Source: Public Records
Map
Nearby Homes
- 326 W Grand Ave
- 416 W Southern Ave
- 506 W Southern Ave
- 409 W Southern Ave
- 424 W State St
- 329 Fair St
- 642 W Euclid Ave
- 702 S Wittenberg Ave
- 516 W Clark St
- 924 W State St
- 427 Rosewood Ave
- 738 S Center St Unit 740
- 830 Dibert Ave
- 525 S Light St
- 1029 S Fountain Ave
- 1361 Woodward Ave
- 929 S Western Ave
- 1603 W Wittenberg Blvd
- 540 Mead Ln
- 711 W Mulberry St
- 414 W Euclid Ave
- 408 W Euclid Ave
- 402 W Euclid Ave Unit 404
- 420 W Euclid Ave
- 422 W Euclid Ave
- 409 W Liberty St
- 405 W Liberty St
- 411 W Liberty St
- 426 W Euclid Ave
- 401 W Liberty St
- 350 W Euclid Ave
- 417 W Liberty St
- 421 W Liberty St
- 409 W Euclid Ave
- 411 W Euclid Ave
- 405 W Euclid Ave
- 346 W Euclid Ave
- 345 W Liberty St
- 425 W Liberty St
- 427 W Euclid Ave