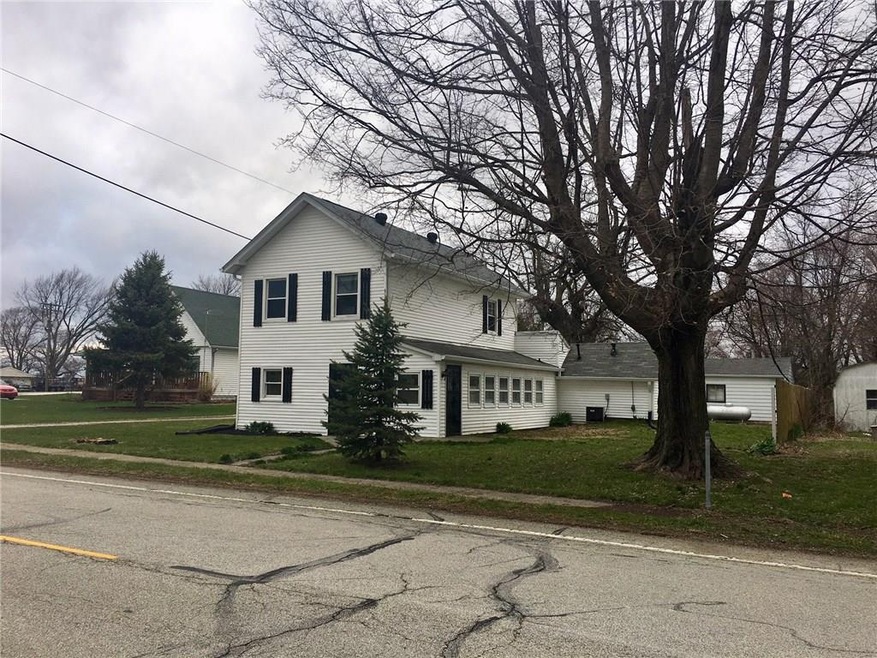
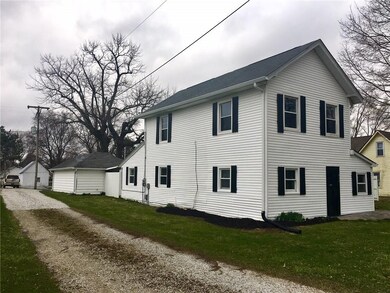
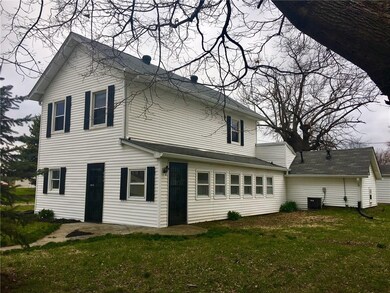
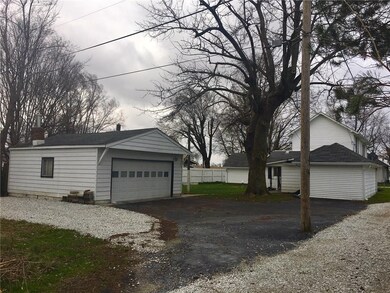
406 W Main St Lizton, IN 46149
Highlights
- Shed
- Forced Air Heating and Cooling System
- Partially Fenced Property
- North Salem Elementary School Rated A-
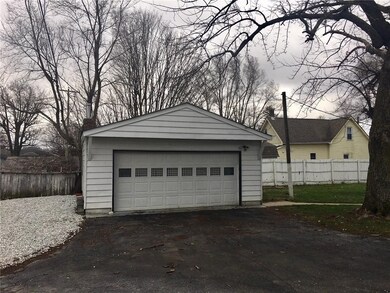
- Garage
- 2-minute walk to Lizton Lions Club
About This Home
As of May 2018Multiple offers received. Seller has requested highest and best by 5pm 4/8/18. Conventional/cash offers and "as is" will get higher priority.
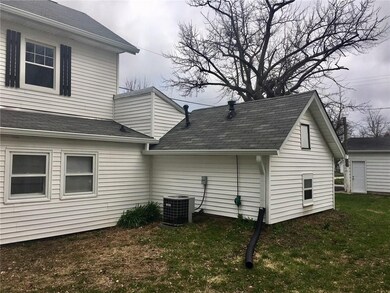
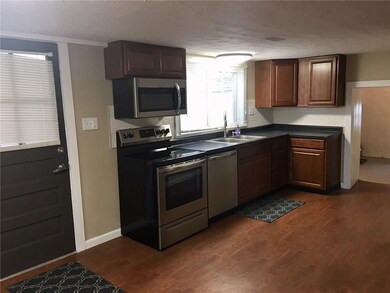
Newly remodeled and move-in ready. 3 Bed/2 Full Bath home with master on main level. Additional enclosed sun room, laundry/utility room and detached in-law quarters not included in 1,536SF. In-law quarters (288SF) has small kitchenette and full bathroom. 22'x24' detached 2 car garage & 16'x24' storage barn included. Kitchen boasts new subway tile backsplash and stainless steel kitchen appliances and cabinets. New carpet and remodeled bathroom.
Last Buyer's Agent
Larry Gregory
Sandcastle Real Estate, LLC

Home Details
Home Type
- Single Family
Est. Annual Taxes
- $2,078
Year Built
- Built in 1926
Lot Details
- 0.33 Acre Lot
- Partially Fenced Property
Home Design
- Vinyl Siding
Interior Spaces
- 2-Story Property
- Window Screens
- Attic Access Panel
- Fire and Smoke Detector
Kitchen
- Electric Oven
- Built-In Microwave
- Dishwasher
Bedrooms and Bathrooms
- 3 Bedrooms
Parking
- Garage
- Driveway
Outdoor Features
- Shed
Utilities
- Forced Air Heating and Cooling System
- Heating System Uses Propane
- Well
Listing and Financial Details
- Assessor Parcel Number 320329437002000021
Ownership History
Purchase Details
Home Financials for this Owner
Home Financials are based on the most recent Mortgage that was taken out on this home.Purchase Details
Home Financials for this Owner
Home Financials are based on the most recent Mortgage that was taken out on this home.Purchase Details
Home Financials for this Owner
Home Financials are based on the most recent Mortgage that was taken out on this home.Purchase Details
Home Financials for this Owner
Home Financials are based on the most recent Mortgage that was taken out on this home.Map
Home Values in the Area
Average Home Value in this Area
Purchase History
| Date | Type | Sale Price | Title Company |
|---|---|---|---|
| Warranty Deed | -- | None Available | |
| Deed | $95,000 | -- | |
| Quit Claim Deed | -- | Royal Title | |
| Interfamily Deed Transfer | -- | Nations Title |
Mortgage History
| Date | Status | Loan Amount | Loan Type |
|---|---|---|---|
| Open | $154,000 | New Conventional | |
| Previous Owner | $94,604 | FHA | |
| Previous Owner | $106,328 | FHA | |
| Previous Owner | $85,412 | FHA |
Property History
| Date | Event | Price | Change | Sq Ft Price |
|---|---|---|---|---|
| 05/23/2018 05/23/18 | Sold | $164,000 | +3.1% | $107 / Sq Ft |
| 04/08/2018 04/08/18 | Pending | -- | -- | -- |
| 04/05/2018 04/05/18 | For Sale | $159,000 | +67.4% | $104 / Sq Ft |
| 01/25/2018 01/25/18 | Sold | $95,000 | 0.0% | $62 / Sq Ft |
| 01/15/2018 01/15/18 | Price Changed | $95,000 | +9499900.0% | $62 / Sq Ft |
| 01/13/2018 01/13/18 | Pending | -- | -- | -- |
| 12/12/2017 12/12/17 | For Sale | $1 | -100.0% | $0 / Sq Ft |
| 03/28/2014 03/28/14 | Sold | $110,000 | 0.0% | $72 / Sq Ft |
| 01/06/2014 01/06/14 | For Sale | $110,000 | 0.0% | $72 / Sq Ft |
| 01/01/2014 01/01/14 | Off Market | $110,000 | -- | -- |
| 11/20/2013 11/20/13 | Price Changed | $110,000 | -4.3% | $72 / Sq Ft |
| 11/07/2013 11/07/13 | Price Changed | $115,000 | 0.0% | $75 / Sq Ft |
| 11/07/2013 11/07/13 | For Sale | $115,000 | +4.5% | $75 / Sq Ft |
| 11/01/2013 11/01/13 | Off Market | $110,000 | -- | -- |
| 08/22/2013 08/22/13 | Price Changed | $119,900 | -4.0% | $78 / Sq Ft |
| 07/22/2013 07/22/13 | For Sale | $124,900 | -- | $81 / Sq Ft |
Tax History
| Year | Tax Paid | Tax Assessment Tax Assessment Total Assessment is a certain percentage of the fair market value that is determined by local assessors to be the total taxable value of land and additions on the property. | Land | Improvement |
|---|---|---|---|---|
| 2024 | $1,952 | $197,200 | $23,500 | $173,700 |
| 2023 | $1,903 | $190,400 | $22,700 | $167,700 |
| 2022 | $2,095 | $173,800 | $21,600 | $152,200 |
| 2021 | $1,921 | $159,800 | $21,600 | $138,200 |
| 2020 | $1,970 | $163,500 | $21,600 | $141,900 |
| 2019 | $1,924 | $159,000 | $20,900 | $138,100 |
| 2018 | $1,230 | $109,100 | $20,900 | $88,200 |
| 2017 | $2,178 | $101,700 | $19,300 | $82,400 |
| 2016 | $1,087 | $99,900 | $19,300 | $80,600 |
| 2014 | $925 | $96,600 | $18,800 | $77,800 |
Source: MIBOR Broker Listing Cooperative®
MLS Number: MBR21555871
APN: 32-03-29-437-002.000-021
Disclaimer: Certain information contained herein is derived from information provided by parties other than Homes.com. All information provided is deemed reliable, but is not guaranteed to be accurate and should be independently verified.
![]() Based on information submitted to the MLS GRID. All data is obtained from various sources and may not have been verified by broker or MLS GRID. Supplied Open House Information is subject to change without notice. All information should be independently reviewed and verified for accuracy. Properties may or may not be listed by the office/agent presenting the information. Some IDX listings have been excluded from this website.
Based on information submitted to the MLS GRID. All data is obtained from various sources and may not have been verified by broker or MLS GRID. Supplied Open House Information is subject to change without notice. All information should be independently reviewed and verified for accuracy. Properties may or may not be listed by the office/agent presenting the information. Some IDX listings have been excluded from this website.
- 431 W Main St
- NO ADDRESS No Street Name
- 6024 N County Road 50 W
- 1598 Commerce Way
- 9615 N County Road 150 E
- 725 E County Road 600 N
- 7154 S 325 W
- 1075 Galaxy Ln
- 97 N Maple St
- 145 Stamford Dr
- 286 S Woodridge Dr
- 131 Stamford Dr
- 122 Stamford Dr
- 449 Hidden Hills Dr
- 5925 Leisure Ln
- 567 Hidden Hills Dr
- 288 Commodore Dr
- 279 Commodore Dr
- 250 Ambassador Dr
- 345 E Main St