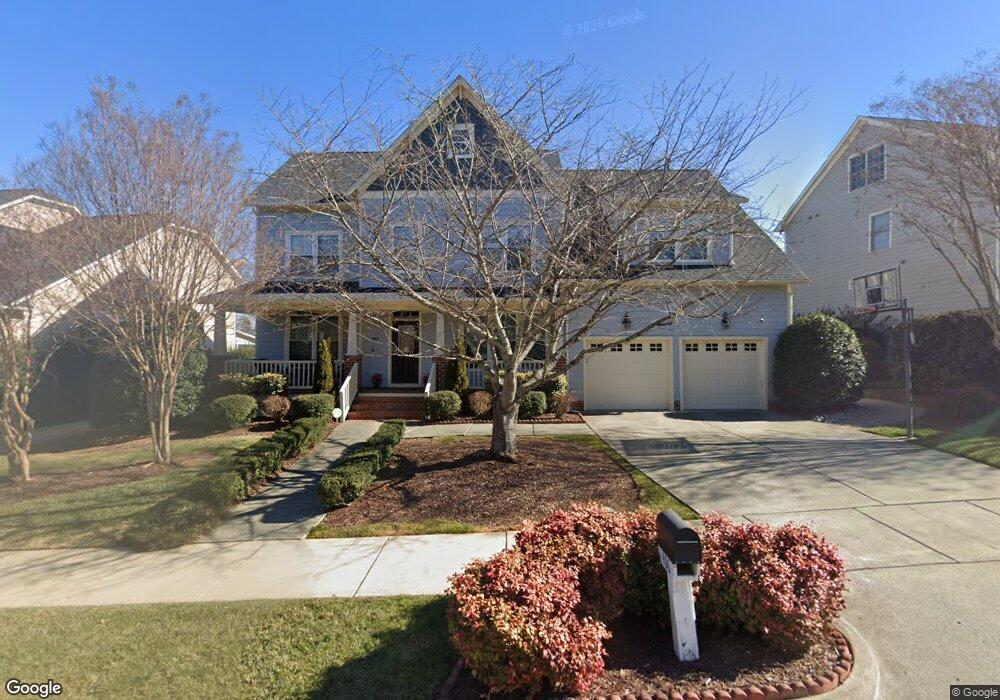
406 Waverly Hills Dr Cary, NC 27519
Cary Park NeighborhoodEstimated Value: $947,000 - $1,018,369
5
Beds
4
Baths
4,029
Sq Ft
$246/Sq Ft
Est. Value
About This Home
This home is located at 406 Waverly Hills Dr, Cary, NC 27519 and is currently estimated at $992,592, approximately $246 per square foot. 406 Waverly Hills Dr is a home located in Wake County with nearby schools including Mills Park Elementary School, Mills Park Middle School, and Green Level High School.
Ownership History
Date
Name
Owned For
Owner Type
Purchase Details
Closed on
Jan 3, 2018
Sold by
Fedich Douglas A and Fedich Kate M
Bought by
Rebeyrat Pierre Andre and Rebeyrat Ludivine
Current Estimated Value
Purchase Details
Closed on
Jun 19, 2013
Sold by
Myers Jeffrey A and Myers Nancy K
Bought by
Fedich Douglas A and Fedich Kate M
Home Financials for this Owner
Home Financials are based on the most recent Mortgage that was taken out on this home.
Original Mortgage
$380,000
Interest Rate
4.58%
Mortgage Type
New Conventional
Purchase Details
Closed on
Sep 12, 2002
Sold by
Parker & Orleans Homebuilders Inc
Bought by
Myers Jeffrey A and Myers Nancy K
Home Financials for this Owner
Home Financials are based on the most recent Mortgage that was taken out on this home.
Original Mortgage
$318,050
Interest Rate
6.13%
Mortgage Type
Balloon
Create a Home Valuation Report for This Property
The Home Valuation Report is an in-depth analysis detailing your home's value as well as a comparison with similar homes in the area
Home Values in the Area
Average Home Value in this Area
Purchase History
| Date | Buyer | Sale Price | Title Company |
|---|---|---|---|
| Rebeyrat Pierre Andre | $523,000 | None Available | |
| Fedich Douglas A | $475,000 | None Available | |
| Myers Jeffrey A | $398,000 | -- |
Source: Public Records
Mortgage History
| Date | Status | Borrower | Loan Amount |
|---|---|---|---|
| Previous Owner | Fedich Douglas A | $380,000 | |
| Previous Owner | Myers Jeffrey A | $318,050 |
Source: Public Records
Tax History Compared to Growth
Tax History
| Year | Tax Paid | Tax Assessment Tax Assessment Total Assessment is a certain percentage of the fair market value that is determined by local assessors to be the total taxable value of land and additions on the property. | Land | Improvement |
|---|---|---|---|---|
| 2025 | -- | $861,961 | $240,000 | $621,961 |
| 2024 | $7,248 | $861,961 | $240,000 | $621,961 |
| 2023 | $5,548 | $551,701 | $116,000 | $435,701 |
| 2022 | $5,341 | $551,701 | $116,000 | $435,701 |
| 2021 | $5,234 | $551,701 | $116,000 | $435,701 |
| 2020 | $5,261 | $551,701 | $116,000 | $435,701 |
| 2019 | $5,129 | $477,119 | $116,000 | $361,119 |
| 2018 | $4,812 | $477,119 | $116,000 | $361,119 |
| 2017 | $4,624 | $477,119 | $116,000 | $361,119 |
| 2016 | $4,555 | $477,119 | $116,000 | $361,119 |
| 2015 | $4,699 | $475,295 | $116,000 | $359,295 |
| 2014 | $4,431 | $475,295 | $116,000 | $359,295 |
Source: Public Records
Map
Nearby Homes
- 399 Waverly Hills Dr
- 106 Alden Village Ct
- 103 Alden Village Ct
- 129 Naperville Dr
- 1428 Yates Store Rd
- 939 Alden Bridge Dr
- 202 Oxford Creek Rd
- 133 Keythorpe Ln
- 2005 Mill Gate Ln
- 245 Tidal Pool Way
- 203 Walford Way
- 139 Rivulet Ct
- 147 Rivulet Ct
- 735 Portstewart Dr Unit 735
- 734 Portstewart Dr Unit 734
- 218 Ashdown Forest Ln
- Newport Plan at Hidden Creek
- Sheridan Plan at Hidden Creek
- Hamilton Plan at Hidden Creek
- Wayland Plan at Hidden Creek
- 404 Waverly Hills Dr
- 410 Waverly Hills Dr
- 412 Waverly Hills Dr
- 402 Waverly Hills Dr
- 603 Alden Bridge Dr
- 103 Brookbank Hill Place
- 105 Brookbank Hill Place
- 407 Waverly Hills Dr
- 403 Waverly Hills Dr Unit 24
- 101 Brookbank Hill Place
- 409 Waverly Hills Dr
- 400 Waverly Hills Dr
- 131 Alden Village Ct
- 414 Waverly Hills Dr
- 107 Brookbank Hill Place
- 401 Waverly Hills Dr Unit 23
- 411 Waverly Hills Dr
- 129 Alden Village Ct
- 397 Waverly Hills Dr
- 413 Waverly Hills Dr