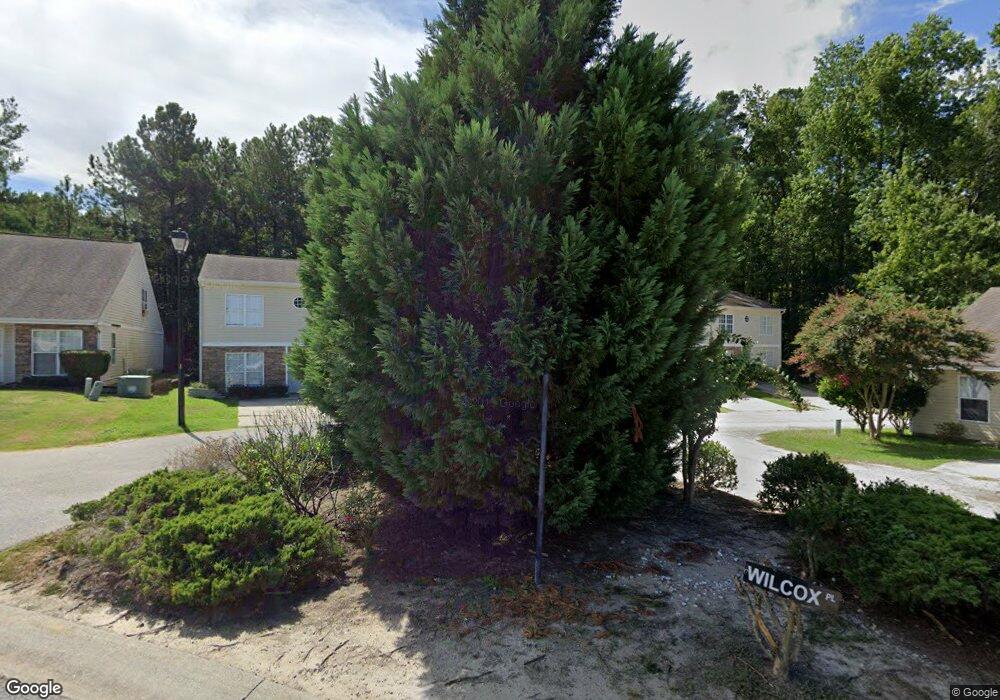
406 Wilcox Place Augusta, GA 30909
Belair NeighborhoodEstimated Value: $200,000 - $254,935
4
Beds
3
Baths
1,975
Sq Ft
$113/Sq Ft
Est. Value
About This Home
This home is located at 406 Wilcox Place, Augusta, GA 30909 and is currently estimated at $222,484, approximately $112 per square foot. 406 Wilcox Place is a home located in Richmond County with nearby schools including Sue Reynolds Elementary School, Langford Middle School, and Johnson Magnet.
Ownership History
Date
Name
Owned For
Owner Type
Purchase Details
Closed on
Mar 31, 2021
Sold by
Chu Llc
Bought by
Isr Seventeen Llc
Current Estimated Value
Purchase Details
Closed on
Feb 25, 2019
Sold by
W M Boyd Enterprises Llc
Bought by
Chu Llc
Purchase Details
Closed on
Jan 17, 2008
Sold by
Boyd Mark and Boyd Wandell Mark
Bought by
W M Boyd Enterprises Llc
Purchase Details
Closed on
Oct 28, 2003
Sold by
Gillespie George J
Bought by
Boyd Wandell Mark
Home Financials for this Owner
Home Financials are based on the most recent Mortgage that was taken out on this home.
Original Mortgage
$75,600
Interest Rate
6%
Mortgage Type
Purchase Money Mortgage
Purchase Details
Closed on
Nov 3, 1999
Sold by
Brent Johnson Build
Bought by
Gillespie George J
Home Financials for this Owner
Home Financials are based on the most recent Mortgage that was taken out on this home.
Original Mortgage
$67,200
Interest Rate
7.81%
Mortgage Type
Purchase Money Mortgage
Create a Home Valuation Report for This Property
The Home Valuation Report is an in-depth analysis detailing your home's value as well as a comparison with similar homes in the area
Home Values in the Area
Average Home Value in this Area
Purchase History
| Date | Buyer | Sale Price | Title Company |
|---|---|---|---|
| Isr Seventeen Llc | -- | -- | |
| Chu Llc | $480,000 | -- | |
| W M Boyd Enterprises Llc | -- | None Available | |
| Boyd Wandell Mark | $84,000 | -- | |
| Gillespie George J | $420,000 | -- |
Source: Public Records
Mortgage History
| Date | Status | Borrower | Loan Amount |
|---|---|---|---|
| Previous Owner | Boyd Wandell Mark | $75,600 | |
| Previous Owner | Gillespie George J | $67,200 |
Source: Public Records
Tax History Compared to Growth
Tax History
| Year | Tax Paid | Tax Assessment Tax Assessment Total Assessment is a certain percentage of the fair market value that is determined by local assessors to be the total taxable value of land and additions on the property. | Land | Improvement |
|---|---|---|---|---|
| 2024 | $2,143 | $80,212 | $10,800 | $69,412 |
| 2023 | $2,143 | $79,876 | $10,800 | $69,076 |
| 2022 | $1,598 | $57,058 | $10,800 | $46,258 |
| 2021 | $1,533 | $49,864 | $9,200 | $40,664 |
| 2020 | $1,158 | $49,864 | $9,200 | $40,664 |
| 2019 | $1,387 | $42,861 | $8,400 | $34,461 |
| 2018 | $1,398 | $42,861 | $8,400 | $34,461 |
| 2017 | $1,390 | $42,861 | $8,400 | $34,461 |
| 2016 | $1,392 | $42,861 | $8,400 | $34,461 |
| 2015 | $1,403 | $42,861 | $8,400 | $34,461 |
| 2014 | $1,711 | $42,720 | $8,400 | $34,320 |
Source: Public Records
Map
Nearby Homes
- 3052 Brems Dr
- 2949 Hillcreek Dr
- 237 Deerfield Ln
- 2631 Chaucer Dr
- 308 Nevis Dr
- 1264 Marks Church Rd
- 300 Nevis Dr
- 3924 Old Trail Rd
- 113 Barts Dr
- 107 Barts Dr
- 3509 Nassau Dr
- 4005 Calypso Dr
- 1402 Marks Church Rd
- 3602 Nassau Dr
- 4019 Calypso Dr
- 2034 Saba Dr
- 3620 Jamaica Dr
- 1422 Leigh Ct
- 3517 Jamaica Dr
- 3951 Foxhill Ct
- 408 Wilcox Place
- 404 Wilcox Place
- 402 Wilcox Place
- 410 Wilcox Place
- 207 Caldwell Cir
- 209 Caldwell Cir
- 205 Caldwell Cir
- 211 Caldwell Cir
- 203 Caldwell Cir
- 213 Caldwell Cir
- 215 Caldwell Cir
- 201 Caldwell Cir
- 217 Caldwell Cir
- 301 Whitney Place
- 219 Caldwell Cir
- 303 Whitney Place
- 221 Caldwell Cir
- 305 Whitney Place
- 221 Caldwell Cirlce Cir
- 307 Whitney Place