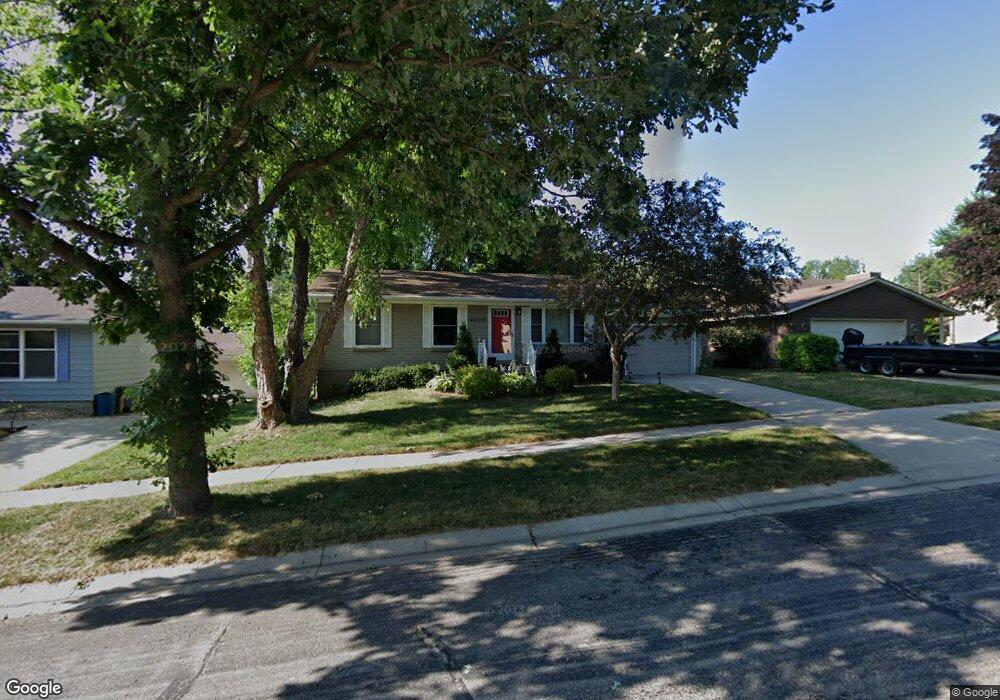
4060 4th Place NW Rochester, MN 55901
The Manor NeighborhoodEstimated Value: $266,000 - $307,000
3
Beds
1
Bath
1,872
Sq Ft
$152/Sq Ft
Est. Value
About This Home
This home is located at 4060 4th Place NW, Rochester, MN 55901 and is currently estimated at $284,205, approximately $151 per square foot. 4060 4th Place NW is a home located in Olmsted County with nearby schools including Bishop Elementary School, John Adams Middle School, and John Marshall Senior High School.
Ownership History
Date
Name
Owned For
Owner Type
Purchase Details
Closed on
Mar 15, 2021
Sold by
Tbt Holdings Llc
Bought by
Kiefer Loren and Huntley Allan
Current Estimated Value
Home Financials for this Owner
Home Financials are based on the most recent Mortgage that was taken out on this home.
Original Mortgage
$196,000
Outstanding Balance
$175,700
Interest Rate
2.7%
Mortgage Type
New Conventional
Estimated Equity
$108,505
Purchase Details
Closed on
Jul 18, 2018
Sold by
Prata Arissa G and Prata Lgor
Bought by
Prata Larissa G and Prata Lgor
Home Financials for this Owner
Home Financials are based on the most recent Mortgage that was taken out on this home.
Original Mortgage
$197,880
Interest Rate
4.6%
Mortgage Type
New Conventional
Purchase Details
Closed on
Jul 16, 2018
Sold by
Schwaller David J and Schwaller Nona J
Bought by
Prata Larissa
Home Financials for this Owner
Home Financials are based on the most recent Mortgage that was taken out on this home.
Original Mortgage
$197,880
Interest Rate
4.6%
Mortgage Type
New Conventional
Create a Home Valuation Report for This Property
The Home Valuation Report is an in-depth analysis detailing your home's value as well as a comparison with similar homes in the area
Home Values in the Area
Average Home Value in this Area
Purchase History
| Date | Buyer | Sale Price | Title Company |
|---|---|---|---|
| Kiefer Loren | $260,000 | None Available | |
| Prata Larissa G | -- | Dodge County Land Title Co | |
| Prata Larissa | $204,000 | Dodge County Land Title Co |
Source: Public Records
Mortgage History
| Date | Status | Borrower | Loan Amount |
|---|---|---|---|
| Open | Kiefer Loren | $196,000 | |
| Previous Owner | Prata Larissa G | $197,880 |
Source: Public Records
Tax History Compared to Growth
Tax History
| Year | Tax Paid | Tax Assessment Tax Assessment Total Assessment is a certain percentage of the fair market value that is determined by local assessors to be the total taxable value of land and additions on the property. | Land | Improvement |
|---|---|---|---|---|
| 2024 | $3,120 | $243,200 | $40,000 | $203,200 |
| 2023 | $2,736 | $231,300 | $40,000 | $191,300 |
| 2022 | $2,372 | $221,000 | $40,000 | $181,000 |
| 2021 | $2,258 | $189,800 | $30,000 | $159,800 |
| 2020 | $2,310 | $181,700 | $30,000 | $151,700 |
| 2019 | $2,168 | $178,900 | $30,000 | $148,900 |
| 2018 | $854 | $170,300 | $30,000 | $140,300 |
| 2017 | $1,708 | $149,500 | $20,000 | $129,500 |
| 2016 | $1,524 | $113,000 | $16,400 | $96,600 |
| 2015 | $718 | $98,400 | $15,800 | $82,600 |
| 2014 | $690 | $99,700 | $15,900 | $83,800 |
| 2012 | -- | $100,400 | $19,873 | $80,527 |
Source: Public Records
Map
Nearby Homes
- 4339 Manor Park Dr NW
- 4444 3rd St NW
- 3938 7th St NW
- 3586 6th St NW
- 650 36th Ave NW
- 660 36th Ave NW
- 4119 Manor View Dr NW
- 188 37th Ave NW
- 468 Panorama Cir NW
- 3415 Lake St NW
- 700 Panorama Cir NW
- 4992 4th St NW
- 3304 Lake St NW
- 4541 Ruby Ln NW
- 360 Wimbledon Hills Dr SW
- 4921 8th St SW
- 3324 Fox Hollow Ln SW
- 4700 Country Club Rd SW
- 5470 Saint Mary Dr NW
- 5185 8th St SW
- 4054 4th Place NW
- 4066 4th Place NW
- 4048 4th Place NW
- 4072 4th Place NW
- 4109 3rd St NW
- 4121 3rd St NW
- 4103 3rd St NW
- 4047 4th Place NW
- 4057 4th Place NW
- 4042 4th Place NW
- 4127 3rd St NW
- 4078 4th Place NW
- 4043 3rd St NW
- 4037 4th Place NW
- 4036 4th Place NW
- 4071 4th Place NW
- 4133 3rd St NW
- 4100 4th Place NW
- 427 40th Avenue Ln NW
- 421 40th Avenue Ln NW