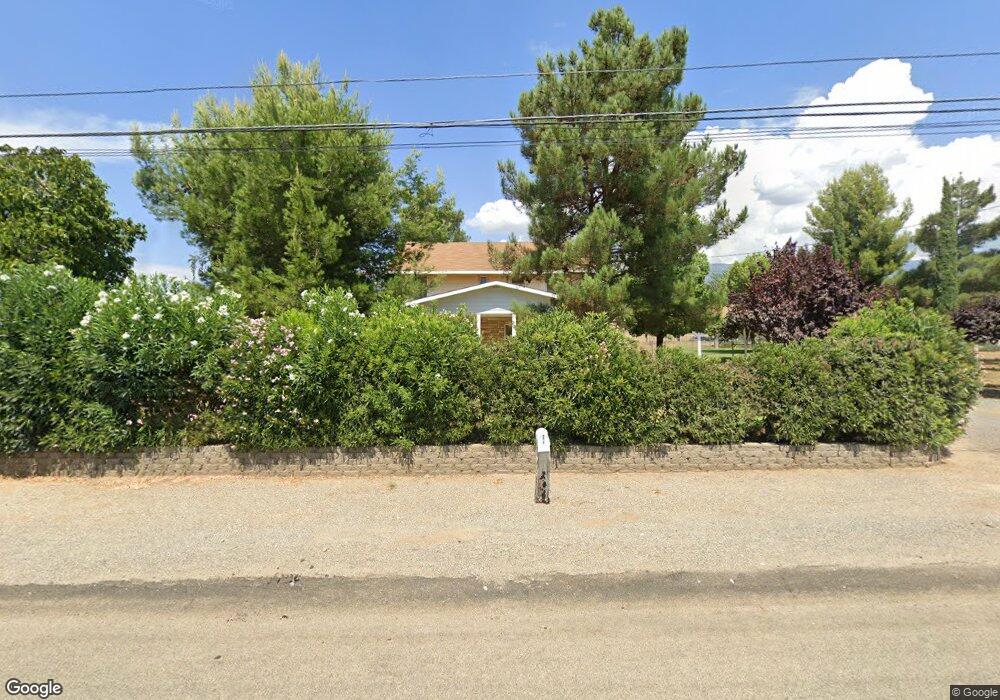
40612 Grand Ave Cherry Valley, CA 92223
Estimated Value: $360,000 - $552,000
3
Beds
3
Baths
1,079
Sq Ft
$402/Sq Ft
Est. Value
About This Home
This home is located at 40612 Grand Ave, Cherry Valley, CA 92223 and is currently estimated at $433,314, approximately $401 per square foot. 40612 Grand Ave is a home located in Riverside County with nearby schools including Starlight Elementary School, San Gorgonio Middle School, and Beaumont Senior High School.
Ownership History
Date
Name
Owned For
Owner Type
Purchase Details
Closed on
May 24, 2016
Sold by
Moffett Sherri M and Sanchez Sherri M
Bought by
Moffett Sherri M
Current Estimated Value
Home Financials for this Owner
Home Financials are based on the most recent Mortgage that was taken out on this home.
Original Mortgage
$145,000
Outstanding Balance
$114,537
Interest Rate
3.59%
Mortgage Type
New Conventional
Estimated Equity
$318,777
Purchase Details
Closed on
Feb 5, 2016
Sold by
Sanchez David A
Bought by
Sanchez Sherri M
Purchase Details
Closed on
Apr 23, 1997
Sold by
Steele Joyce Ann and Berckefeldt Stanley Richard
Bought by
Sanchez David A and Sanchez Sherri M
Home Financials for this Owner
Home Financials are based on the most recent Mortgage that was taken out on this home.
Original Mortgage
$117,792
Interest Rate
8.08%
Mortgage Type
FHA
Purchase Details
Closed on
Jul 15, 1996
Sold by
Breese Eugene C and Breese Reba D
Bought by
Berckefeldt Stanley Richard
Create a Home Valuation Report for This Property
The Home Valuation Report is an in-depth analysis detailing your home's value as well as a comparison with similar homes in the area
Home Values in the Area
Average Home Value in this Area
Purchase History
| Date | Buyer | Sale Price | Title Company |
|---|---|---|---|
| Moffett Sherri M | -- | Orange Coast Title Co Socal | |
| Sanchez Sherri M | -- | None Available | |
| Sanchez David A | $118,500 | Gateway Title Company | |
| Berckefeldt Stanley Richard | -- | -- |
Source: Public Records
Mortgage History
| Date | Status | Borrower | Loan Amount |
|---|---|---|---|
| Open | Moffett Sherri M | $145,000 | |
| Closed | Sanchez David A | $117,792 |
Source: Public Records
Tax History
| Year | Tax Paid | Tax Assessment Tax Assessment Total Assessment is a certain percentage of the fair market value that is determined by local assessors to be the total taxable value of land and additions on the property. | Land | Improvement |
|---|---|---|---|---|
| 2025 | $2,417 | $192,143 | $73,268 | $118,875 |
| 2023 | $2,417 | $184,684 | $70,424 | $114,260 |
| 2022 | $2,377 | $181,064 | $69,044 | $112,020 |
| 2021 | $2,330 | $177,515 | $67,691 | $109,824 |
| 2020 | $2,304 | $175,695 | $66,997 | $108,698 |
| 2019 | $2,267 | $172,251 | $65,684 | $106,567 |
| 2018 | $2,256 | $168,875 | $64,397 | $104,478 |
| 2017 | $2,218 | $165,565 | $63,135 | $102,430 |
| 2016 | $2,158 | $162,320 | $61,898 | $100,422 |
| 2015 | $2,121 | $159,883 | $60,969 | $98,914 |
| 2014 | $1,641 | $122,000 | $47,000 | $75,000 |
Source: Public Records
Map
Nearby Homes
- 40587 High St
- 10435 Frontier Trail
- 10475 Frontier Trail
- 40793 Caballero Dr
- 10751 Deerfield Dr
- 10500 Frontier Trail
- 40833 Caballero Dr
- 40471 Rome Beauty Way
- 40795 Laredo Trail
- 10650 Bel Air Dr
- 10676 Cherry Hills Dr
- 40896 Oregon Trail
- 41030 Inverness Cir
- 40944 Lincoln Place
- 10165 Frontier Trail
- 40587 Dutton St
- 10885 Jonathan Ave
- 11067 Maureen Dr
- 40848 Laredo Trail
- 40918 Cypress Point Dr
- 40576 Grand Ave
- 40534 Grand Ave
- 40605 Grand Ave
- 10574 Winesap Ave
- 40615 Grand Ave
- 10650 Winesap Ave
- 10520 Winesap Ave
- 10587 Winesap Ave
- 40642 Grand Ave
- 10696 Winesap Ave
- 10521 Winesap Ave
- 10539 Bellflower Ave
- 40443 Grand Ave
- 40700 Grand Ave
- 40444 Grand Ave
- 10486 Winesap Ave
- 10746 Winesap Ave
- 10485 Winesap Ave
- 10587 Bellflower Ave
- 10529 Bellflower Ave
Your Personal Tour Guide
Ask me questions while you tour the home.