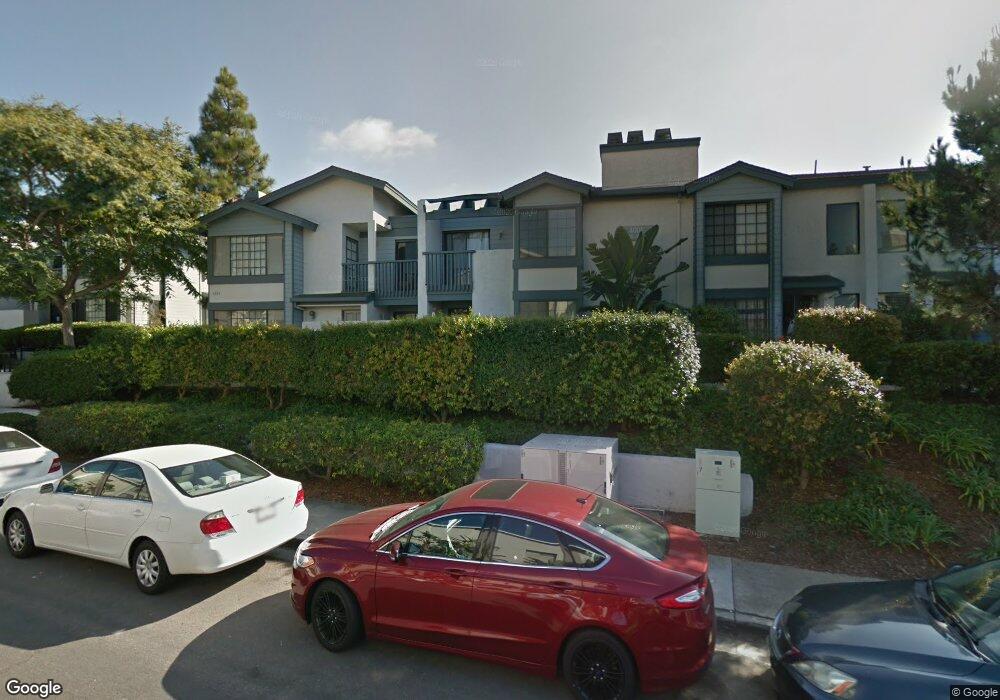
4064 Crystal Dawn Ln Unit 207 San Diego, CA 92122
University City NeighborhoodEstimated Value: $761,880 - $859,000
2
Beds
2
Baths
1,212
Sq Ft
$670/Sq Ft
Est. Value
About This Home
This home is located at 4064 Crystal Dawn Ln Unit 207, San Diego, CA 92122 and is currently estimated at $811,970, approximately $669 per square foot. 4064 Crystal Dawn Ln Unit 207 is a home located in San Diego County with nearby schools including Doyle Elementary School, Standley Middle School, and University City High School.
Ownership History
Date
Name
Owned For
Owner Type
Purchase Details
Closed on
Mar 3, 2023
Sold by
Chu Josephine
Bought by
Josephine Chu Living Trust
Current Estimated Value
Purchase Details
Closed on
Feb 18, 2014
Sold by
Cutting Lydia M
Bought by
Chu Josephine
Home Financials for this Owner
Home Financials are based on the most recent Mortgage that was taken out on this home.
Original Mortgage
$200,000
Interest Rate
4.29%
Mortgage Type
New Conventional
Purchase Details
Closed on
Sep 10, 2010
Sold by
Cutting Lydia M
Bought by
Cutting Lydia M
Purchase Details
Closed on
Sep 20, 2005
Sold by
Markelz Ralph R
Bought by
Cutting Lydia M
Purchase Details
Closed on
Feb 27, 2002
Sold by
Markelz Ralph R
Bought by
Markelz Ralph R
Purchase Details
Closed on
Nov 8, 1984
Create a Home Valuation Report for This Property
The Home Valuation Report is an in-depth analysis detailing your home's value as well as a comparison with similar homes in the area
Home Values in the Area
Average Home Value in this Area
Purchase History
| Date | Buyer | Sale Price | Title Company |
|---|---|---|---|
| Josephine Chu Living Trust | -- | -- | |
| Chu Josephine | $425,000 | Equity Title Company | |
| Cutting Lydia M | -- | None Available | |
| Cutting Lydia M | $455,000 | First American Title Co | |
| Markelz Ralph R | -- | -- | |
| -- | $109,000 | -- |
Source: Public Records
Mortgage History
| Date | Status | Borrower | Loan Amount |
|---|---|---|---|
| Previous Owner | Chu Josephine | $200,000 |
Source: Public Records
Tax History Compared to Growth
Tax History
| Year | Tax Paid | Tax Assessment Tax Assessment Total Assessment is a certain percentage of the fair market value that is determined by local assessors to be the total taxable value of land and additions on the property. | Land | Improvement |
|---|---|---|---|---|
| 2025 | $6,313 | $520,980 | $386,790 | $134,190 |
| 2024 | $6,313 | $510,765 | $379,206 | $131,559 |
| 2023 | $6,174 | $500,751 | $371,771 | $128,980 |
| 2022 | $6,010 | $490,933 | $364,482 | $126,451 |
| 2021 | $5,882 | $481,308 | $357,336 | $123,972 |
| 2020 | $5,810 | $476,373 | $353,672 | $122,701 |
| 2019 | $5,705 | $467,034 | $346,738 | $120,296 |
| 2018 | $5,333 | $457,878 | $339,940 | $117,938 |
| 2017 | $81 | $448,901 | $333,275 | $115,626 |
| 2016 | $5,120 | $440,100 | $326,741 | $113,359 |
| 2015 | $5,044 | $433,491 | $321,834 | $111,657 |
| 2014 | $3,926 | $330,000 | $245,000 | $85,000 |
Source: Public Records
Map
Nearby Homes
- 4064 Crystal Dawn Ln Unit 105
- 4018 Nobel Dr Unit 204
- 4018 Nobel Dr Unit 201
- 3941 Nobel Dr Unit 161
- 3987 Nobel Dr Unit 341
- 3890 Nobel Dr Unit 1203
- 3890 Nobel Dr Unit 1104
- 3890 Nobel Dr Unit 1604
- 3890 Nobel Dr Unit 1505
- 3890 Nobel Dr Unit 1404
- 3890 Nobel Dr Unit 1205
- 3890 Nobel Dr Unit 1706
- 3890 Nobel Dr Unit 302
- 3890 Nobel Dr Unit 1305
- 3890 Nobel Dr Unit 506
- 8308 Regents Rd Unit 1H
- 8338 Regents Rd Unit 1S
- 9237 Regents Rd Unit K101
- 9253 Regents Rd Unit A107
- 4165 Executive Dr Unit F107
- 4064 Crystal Dawn Ln
- 4064 Crystal Dawn Ln Unit 203
- 4064 Crystal Dawn Ln Unit 201
- 4064 Crystal Dawn Ln Unit 107
- 4064 Crystal Dawn Ln Unit 106
- 4064 Crystal Dawn Ln Unit 104
- 4064 Crystal Dawn Ln Unit 103
- 4064 Crystal Dawn Ln Unit 102
- 4044 Crystal Dawn Ln Unit 201
- 4044 Crystal Dawn Ln Unit 104
- 4044 Crystal Dawn Ln Unit 103
- 4044 Crystal Dawn Ln Unit 102
- 4044 Crystal Dawn Ln Unit 101
- 4044 Crystal Dawn Ln Unit 204
- 4044 Crystal Dawn Ln Unit 203
- 4084 Crystal Dawn Ln
- 4084 Crytstal Dawn Ln Unit 103
- 4084 Crystal Dawn Ln
- 4084 Crystal Dawn Ln Unit 104
- 4084 Crystal Dawn Ln Unit 103