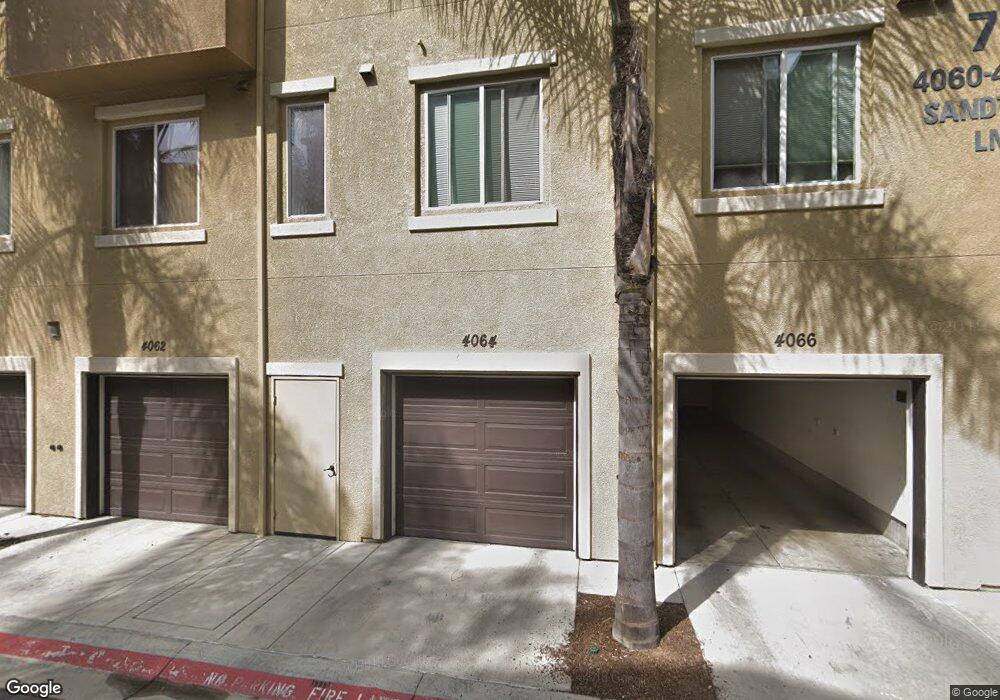
4064 Sandton Ln Unit 708 San Diego, CA 92105
El Cerrito NeighborhoodEstimated Value: $627,000 - $689,000
2
Beds
3
Baths
1,494
Sq Ft
$440/Sq Ft
Est. Value
About This Home
This home is located at 4064 Sandton Ln Unit 708, San Diego, CA 92105 and is currently estimated at $656,629, approximately $439 per square foot. 4064 Sandton Ln Unit 708 is a home located in San Diego County with nearby schools including Fay Elementary School, Mann Middle School, and Crawford High School.
Ownership History
Date
Name
Owned For
Owner Type
Purchase Details
Closed on
Dec 29, 2022
Sold by
George Franklin Sweeney and George Lauren Marie
Bought by
Martinez-Lopez Sergio and Ibarra Miriam Isamar
Current Estimated Value
Home Financials for this Owner
Home Financials are based on the most recent Mortgage that was taken out on this home.
Original Mortgage
$530,000
Outstanding Balance
$512,601
Interest Rate
6.27%
Mortgage Type
New Conventional
Estimated Equity
$144,028
Purchase Details
Closed on
Dec 18, 2015
Sold by
Sweeney George Franklin and Sweeney Lauren Marie
Bought by
Sweeney George Franklin and Sweeney Lauren S
Purchase Details
Closed on
May 26, 2009
Sold by
Kb Home Coastal Inc
Bought by
Sweeney Lauren Marie and Sweeney George Franklin
Home Financials for this Owner
Home Financials are based on the most recent Mortgage that was taken out on this home.
Original Mortgage
$258,655
Interest Rate
4.8%
Mortgage Type
FHA
Create a Home Valuation Report for This Property
The Home Valuation Report is an in-depth analysis detailing your home's value as well as a comparison with similar homes in the area
Home Values in the Area
Average Home Value in this Area
Purchase History
| Date | Buyer | Sale Price | Title Company |
|---|---|---|---|
| Martinez-Lopez Sergio | $600,000 | Ticor Title | |
| Sweeney George Franklin | -- | None Available | |
| Sweeney Lauren Marie | $263,500 | First American Title Ins Co |
Source: Public Records
Mortgage History
| Date | Status | Borrower | Loan Amount |
|---|---|---|---|
| Open | Martinez-Lopez Sergio | $530,000 | |
| Previous Owner | Sweeney Lauren Marie | $258,655 |
Source: Public Records
Tax History Compared to Growth
Tax History
| Year | Tax Paid | Tax Assessment Tax Assessment Total Assessment is a certain percentage of the fair market value that is determined by local assessors to be the total taxable value of land and additions on the property. | Land | Improvement |
|---|---|---|---|---|
| 2025 | $7,548 | $624,238 | $225,115 | $399,123 |
| 2024 | $7,548 | $611,999 | $220,701 | $391,298 |
| 2023 | $3,939 | $326,044 | $117,579 | $208,465 |
| 2022 | $3,833 | $319,652 | $115,274 | $204,378 |
| 2021 | $3,806 | $313,385 | $113,014 | $200,371 |
| 2020 | $3,759 | $310,173 | $111,856 | $198,317 |
| 2019 | $3,691 | $304,092 | $109,663 | $194,429 |
| 2018 | $3,450 | $298,130 | $107,513 | $190,617 |
| 2017 | $83 | $292,285 | $105,405 | $186,880 |
| 2016 | $3,311 | $286,555 | $103,339 | $183,216 |
| 2015 | $3,261 | $282,251 | $101,787 | $180,464 |
| 2014 | $3,209 | $276,723 | $99,794 | $176,929 |
Source: Public Records
Map
Nearby Homes
- 5432 Zeil Place
- 5310 Rex Ave Unit 1
- 5506 University Ave
- 5341 Rex Ave
- 5252 Orange Ave Unit 313
- 5700 Bates St Unit 6
- 4013 Oakcrest Dr Unit 3
- 4333 Dawson Ave
- 5055 University Ave Unit a1
- 4041 Oakcrest Dr Unit 207
- 4041 Oakcrest Dr Unit 105
- 5426 Dwight St
- 3416 Winlow St
- 5643 Meade Ave
- 5510 Adelaide Ave Unit 1
- 5511 Adelaide Ave Unit 29
- 4161 Winona Ave Unit 4
- 3636 Lemona Ave Unit B
- 5474 Streamview Dr
- 5550 Adelaide Ave Unit 11
- 5434 Zeil Place
- 5415 Soho View Terrace
- 5414 Soho View Terrace Unit 507
- 5440 Zeil Place
- 4076 Sandton Ln
- 5422 Soho View Terrace
- 5427 Soho View Terrace
- 4075 Sandton Ln
- 4066 Sandton Ln Unit 707
- 5435 Soho View Terrace
- 4080 Union Square Ln Unit 110
- 4068 Union Square Ln
- 5421 Soho View Terrace Unit 306
- 4074 Sandton Ln
- 5413 Soho View Terrace Unit 302
- 5413 Soho View Terrace
- 5419 Zeil Place Unit 605
- 5421 Zeil Place Unit 606
- 5413 Zeil Place
- 5415 Zeil Place Unit 603