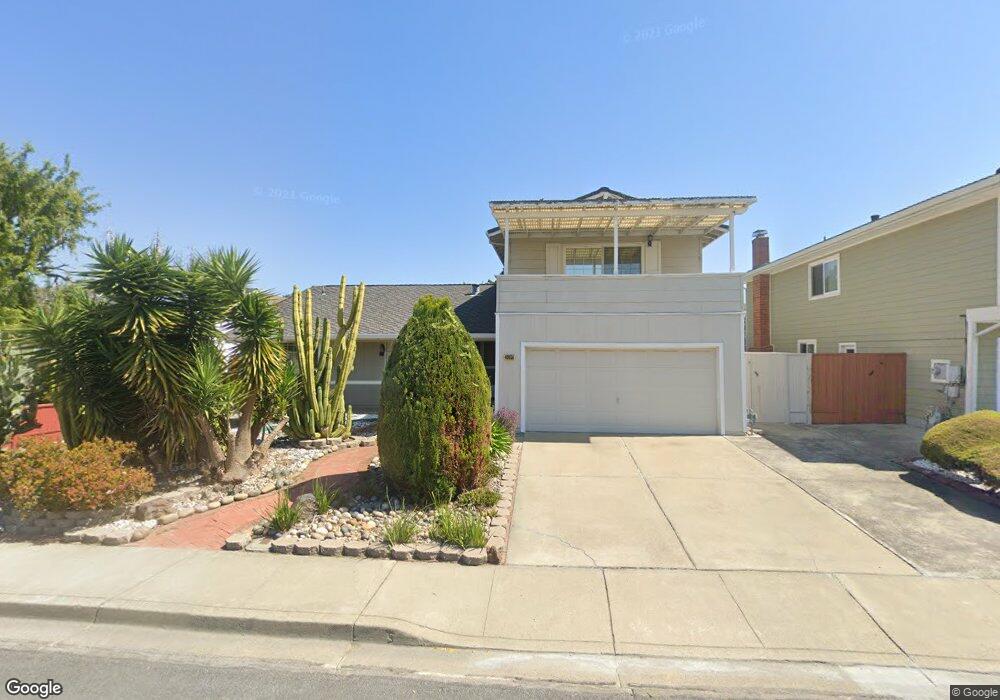
40658 Ambar Place Fremont, CA 94539
Kimber-Gomes NeighborhoodEstimated Value: $1,874,000 - $2,487,000
3
Beds
2
Baths
1,436
Sq Ft
$1,507/Sq Ft
Est. Value
About This Home
This home is located at 40658 Ambar Place, Fremont, CA 94539 and is currently estimated at $2,164,362, approximately $1,507 per square foot. 40658 Ambar Place is a home located in Alameda County with nearby schools including John Gomes Elementary School, William Hopkins Junior High School, and Mission San Jose High School.
Ownership History
Date
Name
Owned For
Owner Type
Purchase Details
Closed on
Jul 21, 2010
Sold by
Hsu Duan Fu Stephen
Bought by
Hsu Duan Fu Stephen
Current Estimated Value
Home Financials for this Owner
Home Financials are based on the most recent Mortgage that was taken out on this home.
Original Mortgage
$200,000
Outstanding Balance
$132,836
Interest Rate
4.71%
Mortgage Type
New Conventional
Estimated Equity
$2,031,526
Purchase Details
Closed on
Aug 18, 2008
Sold by
Hsu Ling
Bought by
Hsu Duan Fu Stephen
Purchase Details
Closed on
Jul 10, 1997
Sold by
Whiting Thomas L and Whiting Sally M
Bought by
Hsu Duan Fu and Hsu Ling C
Home Financials for this Owner
Home Financials are based on the most recent Mortgage that was taken out on this home.
Original Mortgage
$303,500
Interest Rate
7.93%
Create a Home Valuation Report for This Property
The Home Valuation Report is an in-depth analysis detailing your home's value as well as a comparison with similar homes in the area
Home Values in the Area
Average Home Value in this Area
Purchase History
| Date | Buyer | Sale Price | Title Company |
|---|---|---|---|
| Hsu Duan Fu Stephen | -- | Old Republic Title Company | |
| Hsu Duan Fu Stephen | -- | None Available | |
| Hsu Duan Fu | $379,500 | North American Title Co |
Source: Public Records
Mortgage History
| Date | Status | Borrower | Loan Amount |
|---|---|---|---|
| Open | Hsu Duan Fu Stephen | $200,000 | |
| Previous Owner | Hsu Duan Fu | $303,500 |
Source: Public Records
Tax History Compared to Growth
Tax History
| Year | Tax Paid | Tax Assessment Tax Assessment Total Assessment is a certain percentage of the fair market value that is determined by local assessors to be the total taxable value of land and additions on the property. | Land | Improvement |
|---|---|---|---|---|
| 2025 | $7,475 | $598,775 | $181,860 | $423,915 |
| 2024 | $7,475 | $586,900 | $178,295 | $415,605 |
| 2023 | $7,268 | $582,257 | $174,800 | $407,457 |
| 2022 | $7,163 | $563,840 | $171,372 | $399,468 |
| 2021 | $6,990 | $552,648 | $168,012 | $391,636 |
| 2020 | $6,978 | $553,912 | $166,290 | $387,622 |
| 2019 | $6,899 | $543,053 | $163,030 | $380,023 |
| 2018 | $6,763 | $532,407 | $159,834 | $372,573 |
| 2017 | $6,593 | $521,970 | $156,701 | $365,269 |
| 2016 | $6,476 | $511,738 | $153,629 | $358,109 |
| 2015 | $6,385 | $504,051 | $151,321 | $352,730 |
| 2014 | $6,271 | $494,179 | $148,358 | $345,821 |
Source: Public Records
Map
Nearby Homes
- 1401 Lemos Ln
- 260 Jacaranda Dr
- 40379 Dolerita Ave
- 1137 Farragut Dr
- 1962 Briscoe Terrace
- 1123 Farragut Dr
- 40827 Tomales Terrace
- 41043 Joyce Ave
- 2813 Pinnacles Terrace
- 41411 Apricot Ln
- 41246 Mission Blvd
- 41519 Apricot Ln
- 40425 Chapel Way Unit 214
- 40425 Chapel Way Unit 309
- 2851 Finca Terrace
- 40469 Shaw Ct
- 41252 Mission Blvd
- 39478 Zacate Ave
- 41392 Beatrice St
- 3331 Union St
- 40640 Ambar Place
- 40670 Ambar Place
- 40628 Ambar Place
- 40686 Ambar Place
- 1001 Casa Marcia Place
- 40663 Ambar Place
- 1017 Lemos Ln
- 40614 Ambar Place
- 40698 Ambar Place
- 40685 Ambar Place
- 1031 Casa Marcia Place
- 1002 Quintana Way
- 1032 Casa Marcia Place
- 1050 Quintana Way
- 1061 Casa Marcia Place
- 40588 Ambar Place
- 1101 Lemos Ln
- 1062 Casa Marcia Place
- 40705 Laguna Place
- 40706 Ambar Place