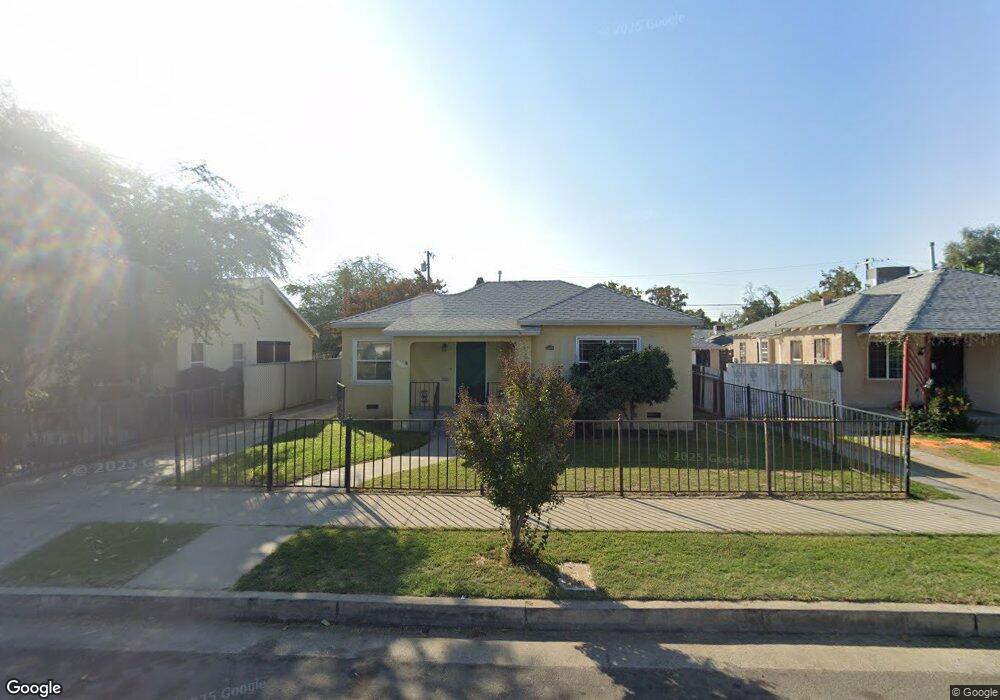
4066 E Lowe Ave Fresno, CA 93702
Huntington NeighborhoodEstimated Value: $170,000 - $244,000
2
Beds
1
Bath
980
Sq Ft
$217/Sq Ft
Est. Value
About This Home
This home is located at 4066 E Lowe Ave, Fresno, CA 93702 and is currently estimated at $212,285, approximately $216 per square foot. 4066 E Lowe Ave is a home located in Fresno County with nearby schools including Winchell Elementary School, Sequoia Middle School, and Roosevelt High School.
Ownership History
Date
Name
Owned For
Owner Type
Purchase Details
Closed on
Oct 12, 2000
Sold by
Hud
Bought by
Ruvalcaba Jesus
Current Estimated Value
Home Financials for this Owner
Home Financials are based on the most recent Mortgage that was taken out on this home.
Original Mortgage
$43,642
Outstanding Balance
$15,961
Interest Rate
7.96%
Mortgage Type
FHA
Estimated Equity
$196,324
Purchase Details
Closed on
Jul 31, 2000
Sold by
Wells Fargo Home Mtg Inc
Bought by
Hud
Purchase Details
Closed on
Mar 15, 2000
Sold by
Wilson Clifford C and Wilson Simona M
Bought by
Norwest Mtg Inc
Purchase Details
Closed on
Oct 14, 1997
Sold by
Wilson Clifford C and Wilson Simona M
Bought by
Wilson Clifford C and Wilson Simona M
Home Financials for this Owner
Home Financials are based on the most recent Mortgage that was taken out on this home.
Original Mortgage
$52,147
Interest Rate
7.49%
Mortgage Type
FHA
Purchase Details
Closed on
Sep 1, 1993
Sold by
Wilson Clifford C and Wilson Simona M
Bought by
Wilson Clifford C and Wilson Simona M
Create a Home Valuation Report for This Property
The Home Valuation Report is an in-depth analysis detailing your home's value as well as a comparison with similar homes in the area
Home Values in the Area
Average Home Value in this Area
Purchase History
| Date | Buyer | Sale Price | Title Company |
|---|---|---|---|
| Ruvalcaba Jesus | $43,500 | North American Title Co | |
| Hud | -- | Fidelity National Title Ins | |
| Norwest Mtg Inc | $57,709 | Fidelity National Title Ins | |
| Wilson Clifford C | -- | Chicago Title Co | |
| Wilson Clifford C | -- | -- |
Source: Public Records
Mortgage History
| Date | Status | Borrower | Loan Amount |
|---|---|---|---|
| Open | Ruvalcaba Jesus | $43,642 | |
| Previous Owner | Wilson Clifford C | $52,147 |
Source: Public Records
Tax History
| Year | Tax Paid | Tax Assessment Tax Assessment Total Assessment is a certain percentage of the fair market value that is determined by local assessors to be the total taxable value of land and additions on the property. | Land | Improvement |
|---|---|---|---|---|
| 2025 | $2,301 | $65,521 | $22,590 | $42,931 |
| 2023 | $2,271 | $62,979 | $21,714 | $41,265 |
| 2022 | $2,243 | $61,745 | $21,289 | $40,456 |
| 2021 | $2,222 | $60,535 | $20,872 | $39,663 |
| 2020 | $2,218 | $59,915 | $20,658 | $39,257 |
| 2019 | $2,191 | $58,741 | $20,253 | $38,488 |
| 2018 | $2,175 | $57,590 | $19,856 | $37,734 |
| 2017 | $642 | $56,462 | $19,467 | $36,995 |
| 2016 | $620 | $55,356 | $19,086 | $36,270 |
| 2015 | $610 | $54,526 | $18,800 | $35,726 |
| 2014 | $594 | $53,459 | $18,432 | $35,027 |
Source: Public Records
Map
Nearby Homes
- 3984 E Butler Ave
- 3864 E Lyell Ave
- 3366 E Butler Ave
- 907 S 7th St
- 1456 S Chance Ave
- 3626 E Lowe Ave
- 622 S 11th St
- 3528 E Lowe Ave
- 3533 E Alta Ave
- 523 S 8th St
- 3844 E Balch Ave
- 3431 E Lowe Ave
- 3402 E Townsend Ave
- 2071 S Cedar Ave
- 832 S 4th St
- 3804 E Kerckhoff Ave
- 4629 E Alta Ave
- 3321 E Montecito Ave
- 4619 E El Monte Way
- 1628 S Hazelwood Blvd
- 4058 E Lowe Ave
- 4074 E Lowe Ave
- 4052 E Lowe Ave
- 4082 E Lowe Ave
- 4046 E Lowe Ave
- 4071 E Liberty Ave
- 4090 E Lowe Ave
- 4063 E Liberty Ave
- 4075 E Liberty Ave
- 4055 E Liberty Ave
- 4081 E Liberty Ave
- 4067 E Lowe Ave
- 4038 E Lowe Ave
- 4061 E Lowe Ave
- 4071 E Lowe Ave
- 4045 E Liberty Ave
- 4091 E Liberty Ave
- 4053 E Lowe Ave
- 4085 E Lowe Ave
- 4045 E Lowe Ave
Your Personal Tour Guide
Ask me questions while you tour the home.