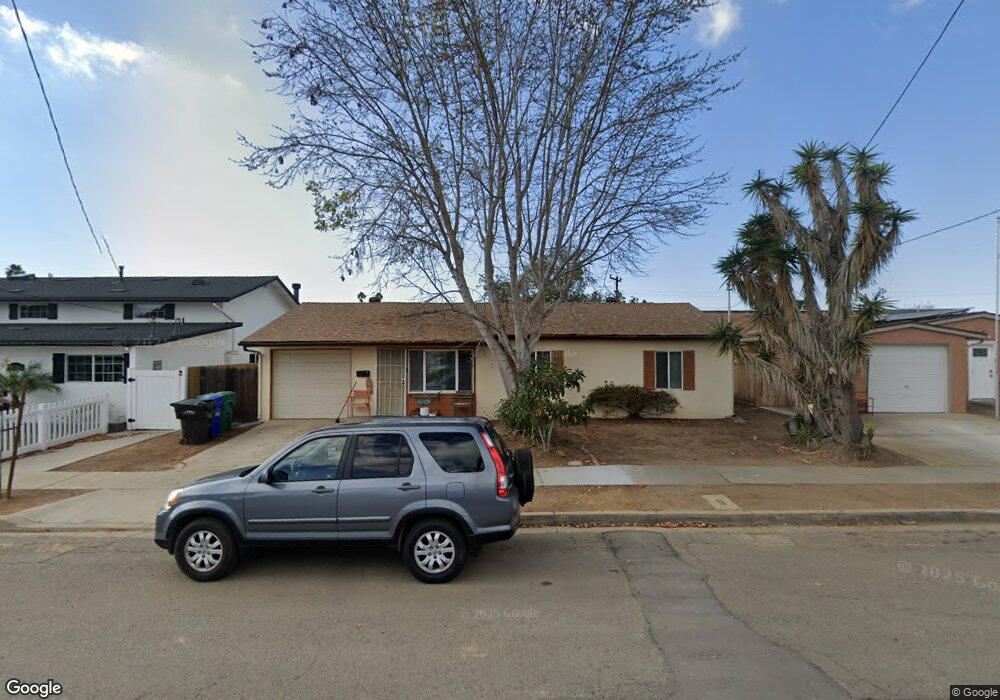
4068 Dalles Ave San Diego, CA 92117
North Clairemont NeighborhoodEstimated Value: $923,006 - $1,046,000
3
Beds
1
Bath
888
Sq Ft
$1,109/Sq Ft
Est. Value
About This Home
This home is located at 4068 Dalles Ave, San Diego, CA 92117 and is currently estimated at $984,752, approximately $1,108 per square foot. 4068 Dalles Ave is a home located in San Diego County with nearby schools including Cadman Elementary School, Marston Middle School, and Clairemont High School.
Ownership History
Date
Name
Owned For
Owner Type
Purchase Details
Closed on
Dec 2, 2019
Sold by
Cooley Norman Michael and Cooley Norman Michael
Bought by
Cooley Norman Michael and Cooley Darlene Yordon
Current Estimated Value
Purchase Details
Closed on
Jul 30, 2019
Sold by
Cooley Norman Michael and Cooley Nancee Leah
Bought by
Cooley Norman Michael
Purchase Details
Closed on
Oct 10, 2017
Sold by
Cooley Norman Michael
Bought by
Cooley Norman Michael and The 2017 Norman Michael Cooley
Purchase Details
Closed on
Oct 27, 2016
Sold by
Cooley Norman Michael and Cooley Nancee Leah
Bought by
Cooley Nancee Leah and Cooley Norman Michael
Purchase Details
Closed on
Apr 3, 2007
Sold by
Cooley Nancee Leah and Cooley Norman Michael
Bought by
Cooley Norman Michael and Cooley Nancee Leah
Purchase Details
Closed on
Jan 21, 1994
Sold by
Cooley Norman Michael
Bought by
Cooley Nancee L
Create a Home Valuation Report for This Property
The Home Valuation Report is an in-depth analysis detailing your home's value as well as a comparison with similar homes in the area
Home Values in the Area
Average Home Value in this Area
Purchase History
| Date | Buyer | Sale Price | Title Company |
|---|---|---|---|
| Cooley Norman Michael | -- | None Available | |
| Cooley Norman Michael | -- | None Available | |
| Cooley Norman Michael | -- | None Available | |
| Cooley Nancee Leah | -- | None Available | |
| Cooley Norman Michael | -- | None Available | |
| Cooley Nancee L | -- | -- |
Source: Public Records
Tax History Compared to Growth
Tax History
| Year | Tax Paid | Tax Assessment Tax Assessment Total Assessment is a certain percentage of the fair market value that is determined by local assessors to be the total taxable value of land and additions on the property. | Land | Improvement |
|---|---|---|---|---|
| 2025 | $1,055 | $84,730 | $25,385 | $59,345 |
| 2024 | $1,055 | $83,070 | $24,888 | $58,182 |
| 2023 | $1,031 | $81,442 | $24,400 | $57,042 |
| 2022 | $1,004 | $79,846 | $23,922 | $55,924 |
| 2021 | $997 | $78,281 | $23,453 | $54,828 |
| 2020 | $986 | $77,479 | $23,213 | $54,266 |
| 2019 | $969 | $75,960 | $22,758 | $53,202 |
| 2018 | $907 | $74,471 | $22,312 | $52,159 |
| 2017 | $80 | $73,012 | $21,875 | $51,137 |
| 2016 | $870 | $71,582 | $21,447 | $50,135 |
| 2015 | $858 | $70,507 | $21,125 | $49,382 |
| 2014 | $845 | $69,127 | $20,712 | $48,415 |
Source: Public Records
Map
Nearby Homes
- 4695 Mount Armet Dr
- 4226 Mount Voss Dr
- 4141 Mount Bigelow Way
- 4203 Tolowa St
- 4380 Rolfe Rd
- 3719 Balboa Terrace Unit A
- 3652 Clairemont Dr Unit 1B
- 4182 Seri St
- 4410 Gila Ave
- 4150 Taos Dr
- 3539 Mount Laurence Dr
- C5 Plan at Mira Vista
- 4840 Canyon View
- C1 Plan at Mira Vista
- 4527 Misty Place
- 4517 Misty Place
- 4511 Misty Place
- 3341 Cadden Dr
- 4048 Raffee Dr
- 3701 Tavara Cir
- 4076 Dalles Ave
- 4060 Dalles Ave
- 4067 Clairemont Dr
- 4052 Dalles Ave
- 4082 Dalles Ave
- 4059 Clairemont Dr
- 4075 Clairemont Dr
- 4075-77 Clairemont Dr
- 4075 Clairemont Dr
- 4065 Dalles Ave
- 4051 Clairemont Dr
- 4083 Clairemont Dr
- 4044 Dalles Ave
- 4071 Dalles Ave
- 4043 Clairemont Dr
- 4043 Dalles Ave
- 4077 Dalles Ave
- 4036 Dalles Ave
- 4091 Dalles Ave
- 4035 Clairemont Dr