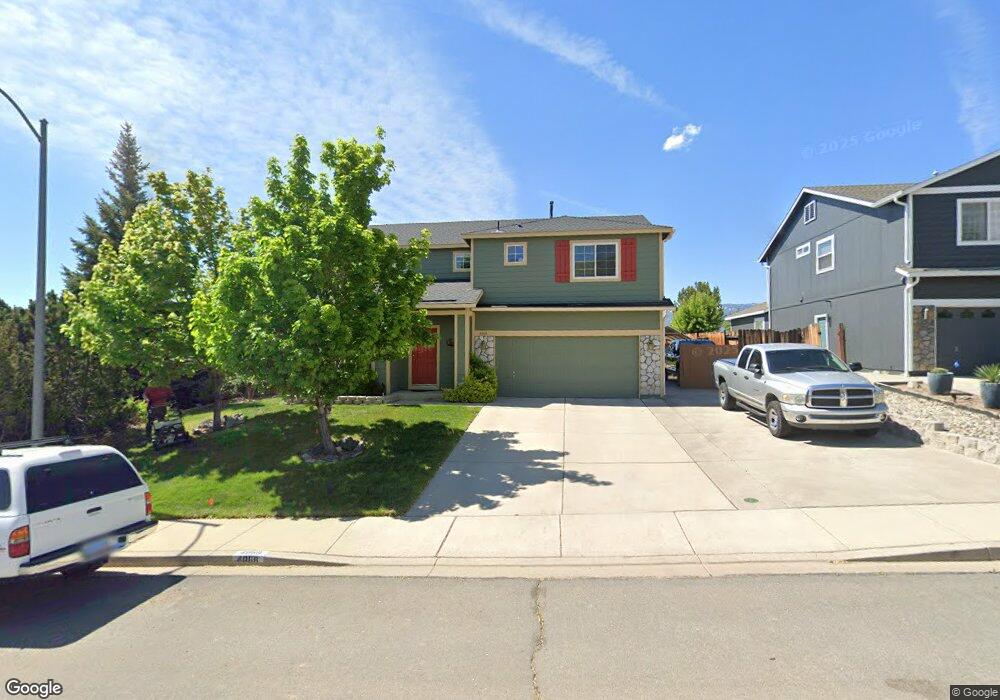
4068 Kings Row Reno, NV 89503
Kings Row NeighborhoodEstimated Value: $675,740 - $743,000
5
Beds
3
Baths
2,420
Sq Ft
$289/Sq Ft
Est. Value
About This Home
This home is located at 4068 Kings Row, Reno, NV 89503 and is currently estimated at $700,185, approximately $289 per square foot. 4068 Kings Row is a home located in Washoe County with nearby schools including Mamie Towles Elementary School, Archie Clayton Pre-AP Academy, and Robert McQueen High School.
Ownership History
Date
Name
Owned For
Owner Type
Purchase Details
Closed on
Jun 9, 2020
Sold by
Victors Mark A and Victors Jacqueline A
Bought by
Victors Mark A and Victors Jacqueline A
Current Estimated Value
Purchase Details
Closed on
Aug 17, 2006
Sold by
Marlow Scott C and Marlow Ann L
Bought by
Victors Mark A and Victors Jackie
Home Financials for this Owner
Home Financials are based on the most recent Mortgage that was taken out on this home.
Original Mortgage
$299,000
Outstanding Balance
$179,515
Interest Rate
6.76%
Mortgage Type
Unknown
Estimated Equity
$520,670
Purchase Details
Closed on
Dec 23, 1999
Sold by
Centex Homes
Bought by
Marlow Scott C and Marlow Ann L
Home Financials for this Owner
Home Financials are based on the most recent Mortgage that was taken out on this home.
Original Mortgage
$193,170
Interest Rate
7.68%
Create a Home Valuation Report for This Property
The Home Valuation Report is an in-depth analysis detailing your home's value as well as a comparison with similar homes in the area
Home Values in the Area
Average Home Value in this Area
Purchase History
| Date | Buyer | Sale Price | Title Company |
|---|---|---|---|
| Victors Mark A | -- | None Available | |
| Victors Mark A | $459,000 | First American Title | |
| Marlow Scott C | $203,500 | First American Title |
Source: Public Records
Mortgage History
| Date | Status | Borrower | Loan Amount |
|---|---|---|---|
| Open | Victors Mark A | $299,000 | |
| Previous Owner | Marlow Scott C | $193,170 |
Source: Public Records
Tax History Compared to Growth
Tax History
| Year | Tax Paid | Tax Assessment Tax Assessment Total Assessment is a certain percentage of the fair market value that is determined by local assessors to be the total taxable value of land and additions on the property. | Land | Improvement |
|---|---|---|---|---|
| 2025 | $3,273 | $125,601 | $44,835 | $80,766 |
| 2024 | $3,273 | $120,045 | $38,500 | $81,545 |
| 2023 | $3,178 | $117,758 | $40,495 | $77,263 |
| 2022 | $3,086 | $97,198 | $32,760 | $64,438 |
| 2021 | $2,997 | $90,027 | $25,830 | $64,197 |
| 2020 | $2,907 | $91,801 | $27,370 | $64,431 |
| 2019 | $2,823 | $90,356 | $28,140 | $62,216 |
| 2018 | $2,742 | $79,847 | $18,830 | $61,017 |
| 2017 | $2,661 | $78,670 | $17,465 | $61,205 |
| 2016 | $2,594 | $77,738 | $15,400 | $62,338 |
| 2015 | $2,543 | $75,743 | $14,700 | $61,043 |
| 2014 | $2,469 | $71,276 | $12,915 | $58,361 |
| 2013 | -- | $65,275 | $10,640 | $54,635 |
Source: Public Records
Map
Nearby Homes
- 4059 Kings Row
- 3981 Regal Dr
- 3967 Kings Row
- 5715 W Brookdale Dr
- 3996 Buckingham Square
- 2967 Aspendale Dr
- 5554 Tappan Dr
- 2195 Santona Cir
- 3181 Sky Country Dr
- 2210 Altamira Dr
- 3520 Balboa Dr
- 3435 Balboa Dr
- 3160 Sky Country Dr
- 3235 Bryan St
- 5765 Tappan Dr
- 3201 Green River Dr
- 5455 Montego Ct
- 5420 Montego Ct
- 5950 Roxbury Ct
- 2130 Canyon Mesa Ct
- 4072 Kings Row
- 4064 Kings Row
- 4076 Kings Row
- 4080 Kings Row
- 4069 Kings Row
- 4056 Kings Row
- 4073 Kings Row
- 4065 Kings Row
- 4077 Kings Row
- 4061 Kings Row
- 2945 Castle Sage Ct
- 4084 Kings Row
- 4081 Kings Row
- 4052 Kings Row
- 4077 Royal Sage Dr
- 4089 Royal Sage Dr
- 2965 Castle Sage Ct
- 2975 Castle Sage Ct
- 4085 Kings Row
- 4081 Royal Sage Dr