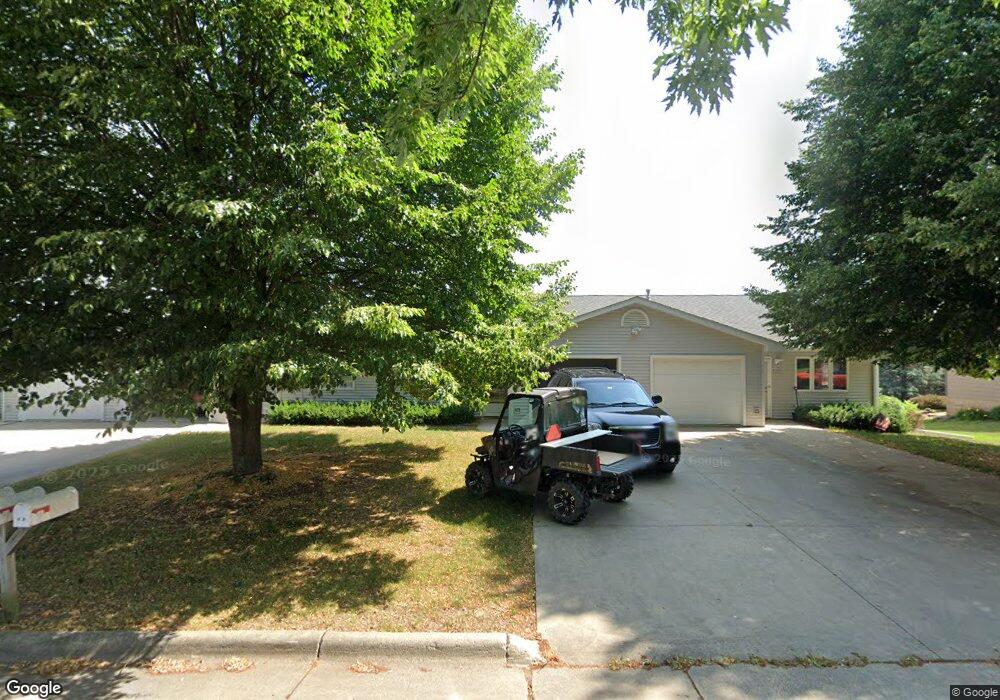
407 1st St NW Spring Grove, MN 55974
Estimated Value: $180,190 - $212,000
2
Beds
2
Baths
1,093
Sq Ft
$177/Sq Ft
Est. Value
About This Home
This home is located at 407 1st St NW, Spring Grove, MN 55974 and is currently estimated at $193,048, approximately $176 per square foot. 407 1st St NW is a home located in Houston County with nearby schools including Spring Grove Elementary School and Spring Grove Secondary School.
Ownership History
Date
Name
Owned For
Owner Type
Purchase Details
Closed on
Dec 12, 2025
Sold by
Terry Sagdalen Rentals Llc
Bought by
Jc Land Management Llp
Current Estimated Value
Purchase Details
Closed on
Nov 1, 2024
Sold by
Terry Sagdalen Rentals Llc
Bought by
Jc Land Management Llp
Purchase Details
Closed on
Jun 26, 2019
Sold by
Sagdalen Terry
Bought by
Terry Sagdalen Rentals
Purchase Details
Closed on
Jun 2, 2017
Sold by
Jc Land Management Llp
Bought by
Sagdalen Terry
Purchase Details
Closed on
Dec 29, 2010
Sold by
Jc Land Management Llp
Bought by
Chandler George and Chandler Harriet
Purchase Details
Closed on
Dec 24, 2010
Sold by
Dvergsten Mervin and Stevens Beth D
Bought by
Jc Land Management Llp
Purchase Details
Closed on
Nov 15, 2010
Sold by
Dvergsten Mervin and Stevens Beth D
Bought by
Jc Land Management Llp
Create a Home Valuation Report for This Property
The Home Valuation Report is an in-depth analysis detailing your home's value as well as a comparison with similar homes in the area
Purchase History
| Date | Buyer | Sale Price | Title Company |
|---|---|---|---|
| Jc Land Management Llp | $100,000 | None Listed On Document | |
| Jc Land Management Llp | $100,000 | -- | |
| Jc Land Management Llp | $100,000 | -- | |
| Terry Sagdalen Rentals | -- | -- | |
| Sagdalen Terry | -- | None Available | |
| Chandler George | $95,000 | None Available | |
| Jc Land Management Llp | $88,000 | None Available | |
| Jc Land Management Llp | $88,000 | None Available |
Source: Public Records
Mortgage History
| Date | Status | Borrower | Loan Amount |
|---|---|---|---|
| Closed | Jc Land Management Llp | $0 |
Source: Public Records
Tax History
| Year | Tax Paid | Tax Assessment Tax Assessment Total Assessment is a certain percentage of the fair market value that is determined by local assessors to be the total taxable value of land and additions on the property. | Land | Improvement |
|---|---|---|---|---|
| 2025 | $2,590 | $161,500 | $9,700 | $151,800 |
| 2024 | $2,542 | $159,400 | $9,700 | $149,700 |
| 2023 | $2,376 | $144,600 | $6,500 | $138,100 |
| 2022 | $2,294 | $137,700 | $6,500 | $131,200 |
| 2021 | $2,086 | $124,900 | $6,500 | $118,400 |
| 2020 | $2,136 | $109,000 | $6,500 | $102,500 |
| 2019 | $2,066 | $109,000 | $6,500 | $102,500 |
| 2018 | $1,900 | $96,500 | $6,500 | $90,000 |
| 2017 | $1,900 | $87,600 | $10,400 | $77,200 |
| 2016 | $2,030 | $87,600 | $10,400 | $77,200 |
| 2015 | $1,284 | $92,700 | $11,000 | $81,700 |
| 2014 | $1,284 | $54,100 | $6,456 | $47,644 |
Source: Public Records
Map
Nearby Homes
- TBD County 8
- 237 S Robert St
- 241 S Robert St
- 44331 State Hwy 44
- 409 Maple St N
- 206 N Maple St
- 215 W Fillmore Ave
- 315 Newburg Ave W
- 209 Oak St S
- 18256 State Hwy 43
- 126 Bissen St
- 12384 Green Acres Dr
- 19708 Camp Winnebago Rd
- xxx E Twin Ridge Rd
- 418 E Monroe St
- 720 S Badger St
- 118 W Grove St
- 510 E Madison St
- 115 E Main St
- 406 E South St
Your Personal Tour Guide
Ask me questions while you tour the home.