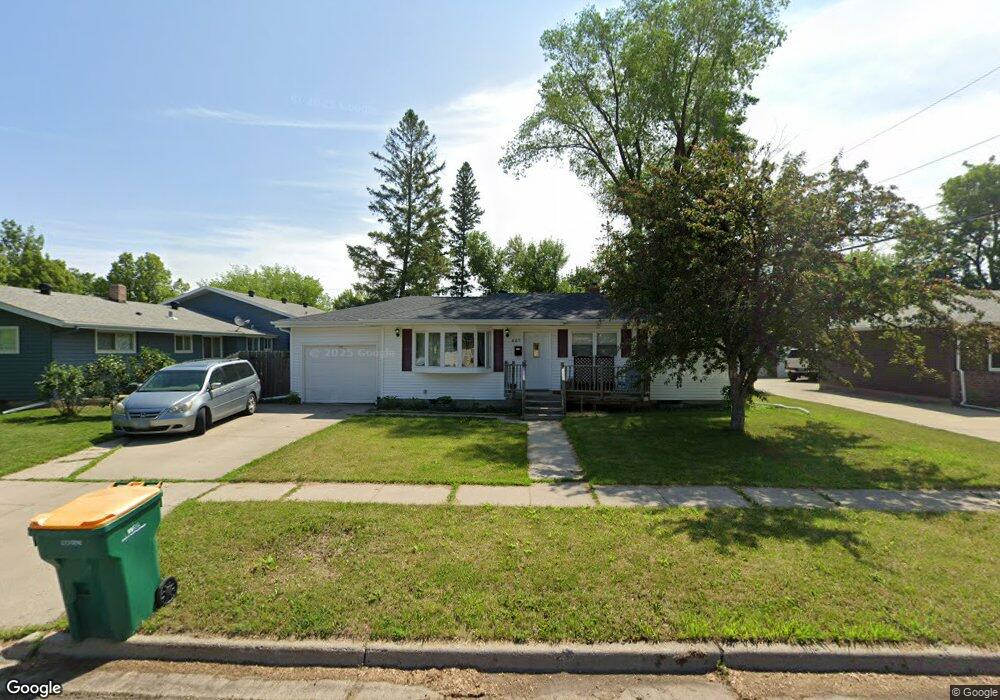
407 3rd St E West Fargo, ND 58078
Sukut's NeighborhoodEstimated Value: $238,046 - $246,000
3
Beds
1
Bath
2,080
Sq Ft
$116/Sq Ft
Est. Value
About This Home
This home is located at 407 3rd St E, West Fargo, ND 58078 and is currently estimated at $242,023, approximately $116 per square foot. 407 3rd St E is a home located in Cass County with nearby schools including L.E. Berger Elementary School, Cheney Middle School, and West Fargo High School.
Ownership History
Date
Name
Owned For
Owner Type
Purchase Details
Closed on
Mar 11, 2016
Sold by
Bixby Kristine
Bought by
Hinton Rthan B and Hinton Rachael Guy
Current Estimated Value
Home Financials for this Owner
Home Financials are based on the most recent Mortgage that was taken out on this home.
Original Mortgage
$166,822
Outstanding Balance
$131,677
Interest Rate
3.65%
Mortgage Type
FHA
Estimated Equity
$110,346
Purchase Details
Closed on
May 28, 2013
Sold by
Groth Eleanore A and Groth Donald L
Bought by
Bixby Kristine
Home Financials for this Owner
Home Financials are based on the most recent Mortgage that was taken out on this home.
Original Mortgage
$114,020
Interest Rate
3.38%
Mortgage Type
Purchase Money Mortgage
Purchase Details
Closed on
Oct 26, 2011
Sold by
Groth Donald L and Groth Eleanore A
Bought by
Groth Eleanore A
Create a Home Valuation Report for This Property
The Home Valuation Report is an in-depth analysis detailing your home's value as well as a comparison with similar homes in the area
Home Values in the Area
Average Home Value in this Area
Purchase History
| Date | Buyer | Sale Price | Title Company |
|---|---|---|---|
| Hinton Rthan B | $149,900 | Title Co | |
| Bixby Kristine | $115,000 | Title Co | |
| Groth Eleanore A | -- | None Available |
Source: Public Records
Mortgage History
| Date | Status | Borrower | Loan Amount |
|---|---|---|---|
| Open | Hinton Rthan B | $166,822 | |
| Previous Owner | Bixby Kristine | $114,020 |
Source: Public Records
Tax History
| Year | Tax Paid | Tax Assessment Tax Assessment Total Assessment is a certain percentage of the fair market value that is determined by local assessors to be the total taxable value of land and additions on the property. | Land | Improvement |
|---|---|---|---|---|
| 2025 | $1,197 | $99,250 | $21,250 | $78,000 |
| 2024 | $2,015 | $93,950 | $17,950 | $76,000 |
| 2023 | $2,589 | $96,250 | $17,950 | $78,300 |
| 2022 | $2,490 | $88,100 | $17,950 | $70,150 |
| 2021 | $2,334 | $78,750 | $13,050 | $65,700 |
| 2020 | $2,310 | $78,950 | $13,050 | $65,900 |
| 2019 | $2,170 | $73,900 | $13,050 | $60,850 |
| 2018 | $2,379 | $85,600 | $13,050 | $72,550 |
| 2017 | $2,251 | $82,850 | $13,050 | $69,800 |
| 2016 | $1,995 | $80,850 | $13,050 | $67,800 |
| 2015 | $2,003 | $74,800 | $11,850 | $62,950 |
| 2014 | $1,960 | $69,900 | $11,850 | $58,050 |
| 2013 | $1,858 | $67,150 | $11,850 | $55,300 |
Source: Public Records
Map
Nearby Homes
- 431 4th Ave E
- 431 5th Ave E Unit 1
- 217 1st Ave E
- 631 7th Ave E
- 620 Sukut St
- 238 Pinewood Blvd
- 228 1st Ave W
- 232 1st Ave W
- 236 1st Ave W
- 622 12th Ave E
- 45 Center St
- 52 Pinewood Blvd
- 226 10 1/2 Ave W
- 245 12th Ave E
- 602 12 1 2 Ave E Unit 5
- 332 13th Ave E
- 520 6th Ave W Unit 8
- 525 10th St E
- 801 9th St E
- 1059 Sommerset Place
Your Personal Tour Guide
Ask me questions while you tour the home.