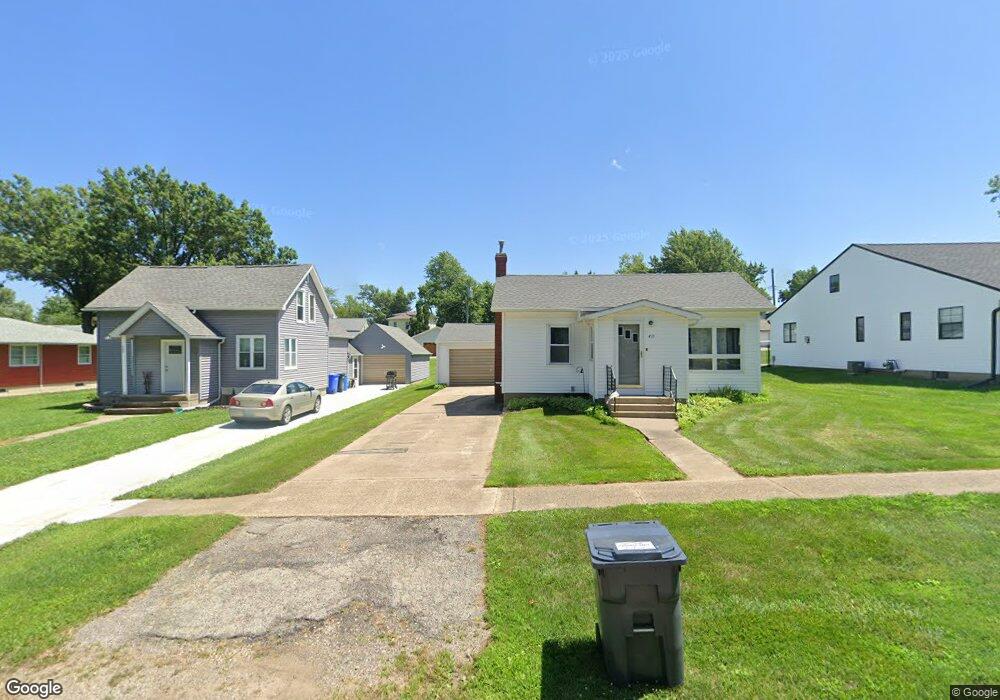
407 4th Ave Unit 76 Clarence, IA 52216
Estimated Value: $152,000 - $172,687
3
Beds
2
Baths
1,185
Sq Ft
$138/Sq Ft
Est. Value
About This Home
This home is located at 407 4th Ave Unit 76, Clarence, IA 52216 and is currently estimated at $163,672, approximately $138 per square foot. 407 4th Ave Unit 76 is a home located in Cedar County with nearby schools including North Cedar Junior/Senior High School.
Ownership History
Date
Name
Owned For
Owner Type
Purchase Details
Closed on
Sep 30, 2024
Sold by
Fellingham Abbie B and Good Brent
Bought by
Ealy Christine
Current Estimated Value
Purchase Details
Closed on
Sep 22, 2020
Sold by
Fellingham Chris
Bought by
Fellingham Abbie
Purchase Details
Closed on
Nov 9, 2014
Sold by
Meyer Derek J and Meyer Beth A
Bought by
Fellingham Abbie B
Home Financials for this Owner
Home Financials are based on the most recent Mortgage that was taken out on this home.
Original Mortgage
$66,326
Interest Rate
4.19%
Mortgage Type
New Conventional
Purchase Details
Closed on
Mar 10, 2009
Sold by
Sprague Michael W and Sprague Mary Ann
Bought by
Meyer Derek J
Home Financials for this Owner
Home Financials are based on the most recent Mortgage that was taken out on this home.
Original Mortgage
$47,959
Interest Rate
5.2%
Mortgage Type
New Conventional
Create a Home Valuation Report for This Property
The Home Valuation Report is an in-depth analysis detailing your home's value as well as a comparison with similar homes in the area
Home Values in the Area
Average Home Value in this Area
Purchase History
| Date | Buyer | Sale Price | Title Company |
|---|---|---|---|
| Ealy Christine | $170,000 | None Listed On Document | |
| Ealy Christine | $170,000 | None Listed On Document | |
| Fellingham Abbie | -- | None Available | |
| Fellingham Abbie B | $65,000 | None Available | |
| Meyer Derek J | $47,000 | None Available |
Source: Public Records
Mortgage History
| Date | Status | Borrower | Loan Amount |
|---|---|---|---|
| Previous Owner | Fellingham Abbie B | $66,326 | |
| Previous Owner | Meyer Derek J | $47,959 |
Source: Public Records
Tax History Compared to Growth
Tax History
| Year | Tax Paid | Tax Assessment Tax Assessment Total Assessment is a certain percentage of the fair market value that is determined by local assessors to be the total taxable value of land and additions on the property. | Land | Improvement |
|---|---|---|---|---|
| 2025 | $1,462 | $166,030 | $14,260 | $151,770 |
| 2024 | $1,462 | $107,120 | $14,260 | $92,860 |
| 2023 | $1,346 | $102,580 | $14,260 | $88,320 |
| 2022 | $1,098 | $73,620 | $12,470 | $61,150 |
| 2021 | $1,126 | $73,620 | $12,470 | $61,150 |
| 2020 | $1,056 | $73,620 | $12,470 | $61,150 |
| 2019 | $652 | $45,320 | $0 | $0 |
| 2018 | $632 | $45,320 | $0 | $0 |
| 2017 | $760 | $50,490 | $0 | $0 |
| 2016 | $742 | $50,490 | $0 | $0 |
| 2015 | $734 | $50,490 | $0 | $0 |
| 2014 | $734 | $50,490 | $0 | $0 |
Source: Public Records
Map
Nearby Homes