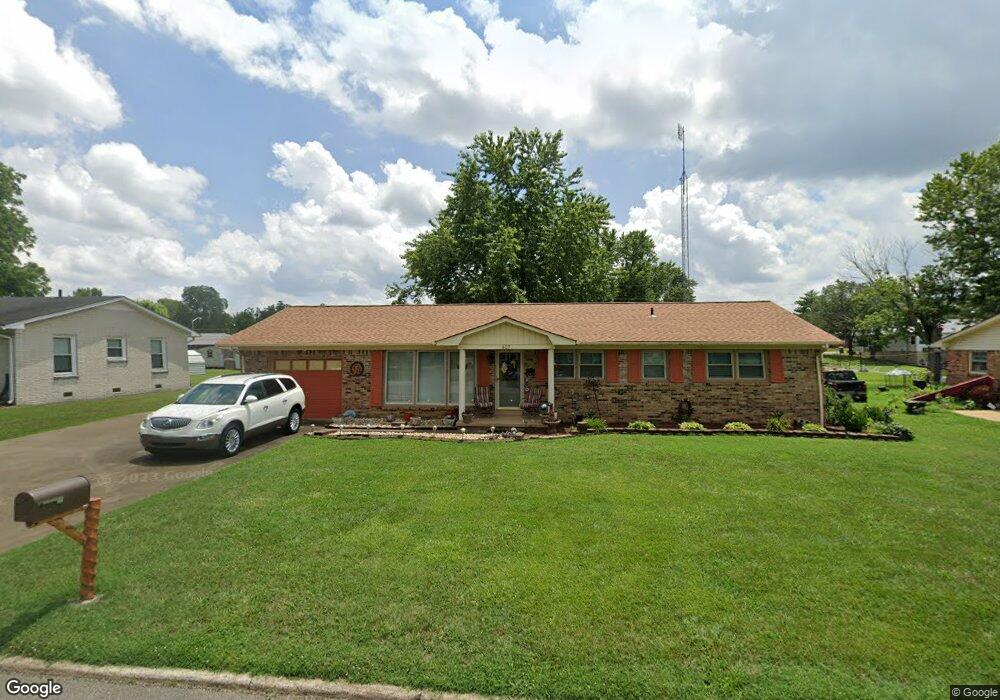
407 8th St Lawrenceburg, TN 38464
Estimated Value: $186,606 - $233,000
--
Bed
2
Baths
1,463
Sq Ft
$150/Sq Ft
Est. Value
About This Home
This home is located at 407 8th St, Lawrenceburg, TN 38464 and is currently estimated at $220,152, approximately $150 per square foot. 407 8th St is a home located in Lawrence County with nearby schools including Ingram Sowell Elementary School, Lawrenceburg Public Elementary School, and David Crockett Elementary School.
Ownership History
Date
Name
Owned For
Owner Type
Purchase Details
Closed on
Oct 18, 2006
Bought by
Robbins Roberta Louise
Current Estimated Value
Purchase Details
Closed on
Nov 26, 1997
Sold by
Norton Edward L
Bought by
Floyd Robbins
Home Financials for this Owner
Home Financials are based on the most recent Mortgage that was taken out on this home.
Original Mortgage
$58,500
Interest Rate
7.19%
Purchase Details
Closed on
Jul 20, 1981
Bought by
Norton Edward L and Norton Edith
Purchase Details
Closed on
Jan 1, 1981
Create a Home Valuation Report for This Property
The Home Valuation Report is an in-depth analysis detailing your home's value as well as a comparison with similar homes in the area
Home Values in the Area
Average Home Value in this Area
Purchase History
| Date | Buyer | Sale Price | Title Company |
|---|---|---|---|
| Robbins Roberta Louise | -- | -- | |
| Floyd Robbins | $65,000 | -- | |
| Norton Edward L | -- | -- | |
| -- | $41,500 | -- |
Source: Public Records
Mortgage History
| Date | Status | Borrower | Loan Amount |
|---|---|---|---|
| Previous Owner | Not Available | $58,500 |
Source: Public Records
Tax History Compared to Growth
Tax History
| Year | Tax Paid | Tax Assessment Tax Assessment Total Assessment is a certain percentage of the fair market value that is determined by local assessors to be the total taxable value of land and additions on the property. | Land | Improvement |
|---|---|---|---|---|
| 2025 | $1,118 | $35,950 | $0 | $0 |
| 2024 | $1,118 | $35,950 | $2,825 | $33,125 |
| 2023 | $1,118 | $35,950 | $2,825 | $33,125 |
| 2022 | $1,118 | $35,950 | $2,825 | $33,125 |
| 2021 | $812 | $18,475 | $1,875 | $16,600 |
| 2020 | $812 | $18,475 | $1,875 | $16,600 |
| 2019 | $812 | $18,475 | $1,875 | $16,600 |
| 2018 | $812 | $18,475 | $1,875 | $16,600 |
| 2017 | $812 | $18,475 | $1,875 | $16,600 |
| 2016 | $812 | $18,475 | $1,875 | $16,600 |
| 2015 | $769 | $18,475 | $1,875 | $16,600 |
| 2014 | $735 | $17,650 | $1,875 | $15,775 |
Source: Public Records
Map
Nearby Homes