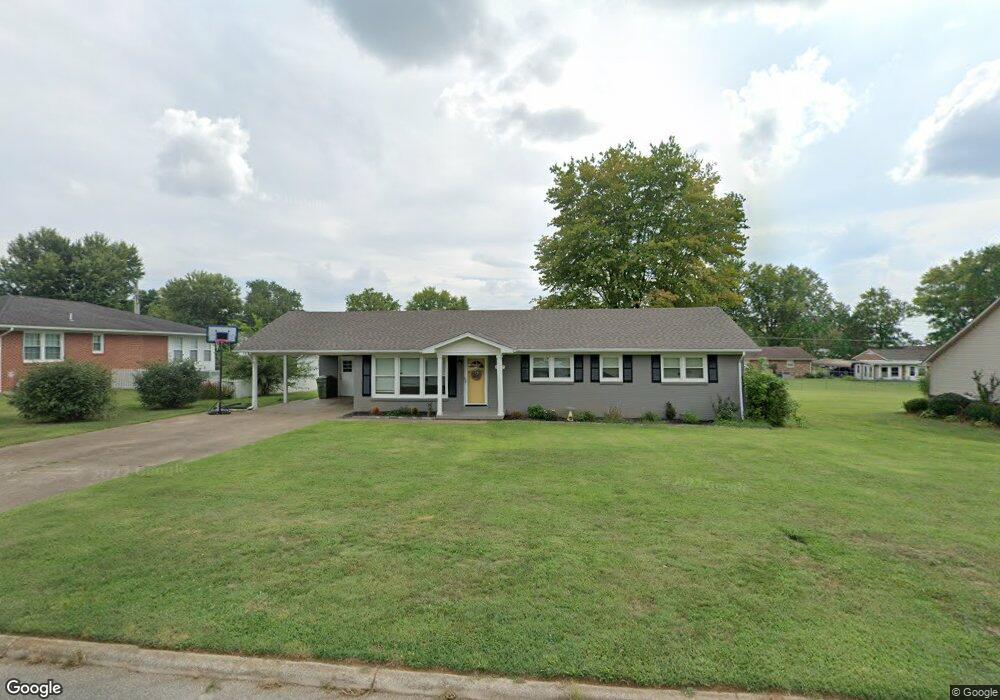
407 9th St Lawrenceburg, TN 38464
Estimated Value: $202,000 - $261,000
--
Bed
2
Baths
1,458
Sq Ft
$160/Sq Ft
Est. Value
About This Home
This home is located at 407 9th St, Lawrenceburg, TN 38464 and is currently estimated at $232,832, approximately $159 per square foot. 407 9th St is a home located in Lawrence County with nearby schools including Ingram Sowell Elementary School, Lawrenceburg Public Elementary School, and David Crockett Elementary School.
Ownership History
Date
Name
Owned For
Owner Type
Purchase Details
Closed on
May 16, 2019
Sold by
Akins Ricky and Porter Kristi
Bought by
Myles Tiffany Lynn
Current Estimated Value
Home Financials for this Owner
Home Financials are based on the most recent Mortgage that was taken out on this home.
Original Mortgage
$141,313
Interest Rate
3.9%
Mortgage Type
New Conventional
Purchase Details
Closed on
Mar 29, 2019
Sold by
Kilpatrick James E and Kilpatrick Eunick N
Bought by
Akins Ricky and Porter Kristi
Home Financials for this Owner
Home Financials are based on the most recent Mortgage that was taken out on this home.
Original Mortgage
$141,313
Interest Rate
3.9%
Mortgage Type
New Conventional
Purchase Details
Closed on
Mar 8, 2018
Sold by
Kilpatrick Eunice N and Shaffer Margie
Bought by
Kilpatrick James E and Kilpatrick Eunice N
Purchase Details
Closed on
Aug 22, 1966
Bought by
Shaffer Wiley
Create a Home Valuation Report for This Property
The Home Valuation Report is an in-depth analysis detailing your home's value as well as a comparison with similar homes in the area
Home Values in the Area
Average Home Value in this Area
Purchase History
| Date | Buyer | Sale Price | Title Company |
|---|---|---|---|
| Myles Tiffany Lynn | $139,900 | None Available | |
| Akins Ricky | $78,000 | None Available | |
| Kilpatrick James E | -- | None Available | |
| Shaffer Wiley | -- | -- |
Source: Public Records
Mortgage History
| Date | Status | Borrower | Loan Amount |
|---|---|---|---|
| Previous Owner | Myles Tiffany Lynn | $141,313 |
Source: Public Records
Tax History Compared to Growth
Tax History
| Year | Tax Paid | Tax Assessment Tax Assessment Total Assessment is a certain percentage of the fair market value that is determined by local assessors to be the total taxable value of land and additions on the property. | Land | Improvement |
|---|---|---|---|---|
| 2025 | $1,333 | $42,875 | $0 | $0 |
| 2024 | $1,333 | $42,875 | $5,000 | $37,875 |
| 2023 | $1,333 | $42,875 | $5,000 | $37,875 |
| 2022 | $1,333 | $42,875 | $5,000 | $37,875 |
| 2021 | $1,214 | $27,625 | $3,750 | $23,875 |
| 2020 | $1,214 | $27,625 | $3,750 | $23,875 |
| 2019 | $823 | $27,625 | $3,750 | $23,875 |
| 2018 | $823 | $18,725 | $3,750 | $14,975 |
| 2017 | $823 | $18,725 | $3,750 | $14,975 |
| 2016 | $823 | $18,725 | $3,750 | $14,975 |
| 2015 | $779 | $18,725 | $3,750 | $14,975 |
| 2014 | $726 | $17,450 | $2,500 | $14,950 |
Source: Public Records
Map
Nearby Homes