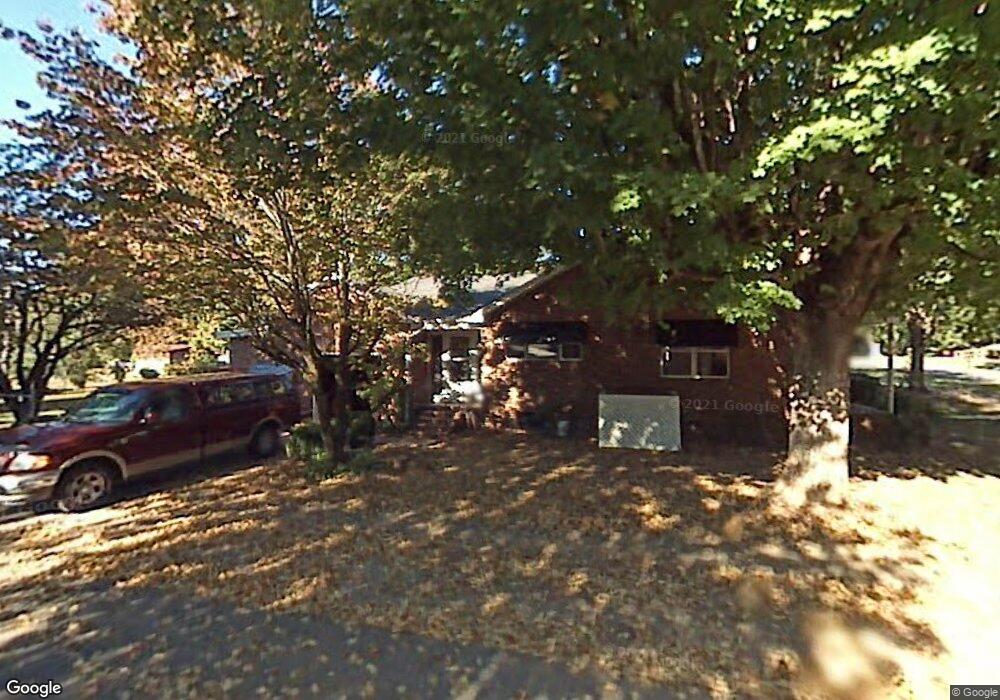
407 Cherry St Dunlap, TN 37327
Estimated Value: $230,143 - $320,000
3
Beds
2
Baths
1,832
Sq Ft
$150/Sq Ft
Est. Value
About This Home
This home is located at 407 Cherry St, Dunlap, TN 37327 and is currently estimated at $274,286, approximately $149 per square foot. 407 Cherry St is a home located in Sequatchie County with nearby schools including Griffith Elementary School, Sequatchie County Middle School, and Sequatchie County High School.
Ownership History
Date
Name
Owned For
Owner Type
Purchase Details
Closed on
Nov 13, 2025
Sold by
Beavers Jimmy Ray and Beavers Diane Wagner
Bought by
Anderson David and Lee-Anderson Pamela
Current Estimated Value
Home Financials for this Owner
Home Financials are based on the most recent Mortgage that was taken out on this home.
Original Mortgage
$255,375
Outstanding Balance
$255,375
Interest Rate
6.34%
Mortgage Type
VA
Estimated Equity
$18,911
Purchase Details
Closed on
Nov 20, 2007
Sold by
Smoot Wagner Barry
Bought by
Ray Beavers Jimmy
Home Financials for this Owner
Home Financials are based on the most recent Mortgage that was taken out on this home.
Original Mortgage
$121,767
Interest Rate
6.29%
Purchase Details
Closed on
Aug 15, 1995
Bought by
Nathan Warren and Nathan Meryle Wagner
Create a Home Valuation Report for This Property
The Home Valuation Report is an in-depth analysis detailing your home's value as well as a comparison with similar homes in the area
Home Values in the Area
Average Home Value in this Area
Purchase History
| Date | Buyer | Sale Price | Title Company |
|---|---|---|---|
| Anderson David | $250,000 | None Listed On Document | |
| Ray Beavers Jimmy | $120,000 | -- | |
| Nathan Warren | $70,000 | -- |
Source: Public Records
Mortgage History
| Date | Status | Borrower | Loan Amount |
|---|---|---|---|
| Open | Anderson David | $255,375 | |
| Previous Owner | Nathan Warren | $121,767 |
Source: Public Records
Tax History Compared to Growth
Tax History
| Year | Tax Paid | Tax Assessment Tax Assessment Total Assessment is a certain percentage of the fair market value that is determined by local assessors to be the total taxable value of land and additions on the property. | Land | Improvement |
|---|---|---|---|---|
| 2025 | $1,417 | $58,675 | $0 | $0 |
| 2024 | $1,417 | $58,675 | $3,500 | $55,175 |
| 2023 | $1,417 | $58,675 | $3,500 | $55,175 |
| 2022 | $1,001 | $30,175 | $2,750 | $27,425 |
| 2021 | $986 | $30,175 | $2,750 | $27,425 |
| 2020 | $986 | $30,175 | $2,750 | $27,425 |
| 2019 | $974 | $29,825 | $2,750 | $27,075 |
| 2018 | $963 | $29,825 | $2,750 | $27,075 |
| 2017 | $952 | $29,825 | $2,750 | $27,075 |
| 2016 | $1,002 | $30,075 | $2,750 | $27,325 |
| 2015 | $1,002 | $30,075 | $2,750 | $27,325 |
| 2014 | $1,002 | $30,075 | $2,750 | $27,325 |
Source: Public Records
Map
Nearby Homes
- 410 Cherry St
- 95 Blue Sky Rd Rd
- 254 Cdl Trail
- 0 SE US Hwy 127 Unit 1519993
- 0 SE US Hwy 127 Unit 1519990
- 0 SE US Hwy 127 Unit 1519988
- 0 SE US Hwy 127 Unit 1314389
- 0 SE US Hwy 127 Unit 1519979
- 0 SE US Hwy 127 Unit 1519991
- 0 SE US Hwy 127 Unit 1519984
- 21550 U S 127
- 0 State Rt 399 Lot 13
- 0 Jericho Rd Unit 1523837
- 0 Jericho Rd Unit RTC3043766
- 0 Jericho Lot 14 Rd
- Lot 13 B Greenfields Way
- 2 Fredonia Rd
- 1 Fredonia Rd
- 3 Fredonia Rd
- 103 Fredonia Rd