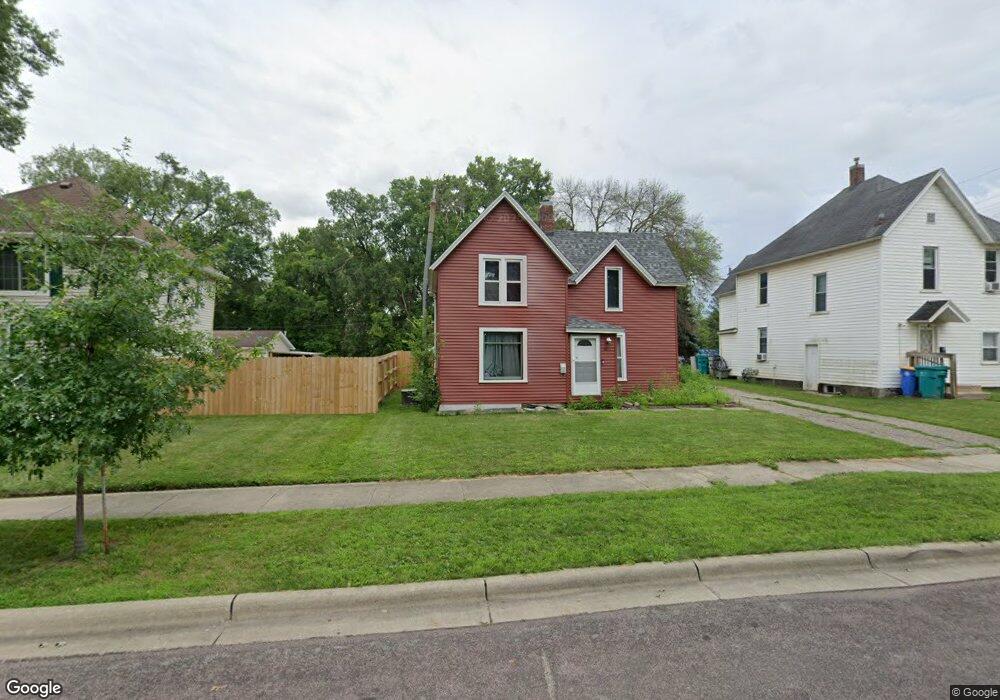
407 Chestnut Ave Owatonna, MN 55060
Estimated Value: $206,420 - $223,000
3
Beds
2
Baths
1,954
Sq Ft
$110/Sq Ft
Est. Value
About This Home
This home is located at 407 Chestnut Ave, Owatonna, MN 55060 and is currently estimated at $214,855, approximately $109 per square foot. 407 Chestnut Ave is a home located in Steele County with nearby schools including Washington Elementary School, Owatonna Middle School, and Owatonna Senior High School.
Ownership History
Date
Name
Owned For
Owner Type
Purchase Details
Closed on
Oct 2, 2020
Sold by
Gonzalez Jose Louis and Gonzalez Maribel Salcedo
Bought by
Barber Trevor D and Peterson Virginia A
Current Estimated Value
Home Financials for this Owner
Home Financials are based on the most recent Mortgage that was taken out on this home.
Original Mortgage
$148,686
Outstanding Balance
$132,248
Interest Rate
2.9%
Mortgage Type
New Conventional
Estimated Equity
$82,607
Purchase Details
Closed on
Apr 8, 2011
Sold by
Secretary Of Housing & Urban Development
Bought by
Tello Jose Luis Gonzalez and Gonzalez Maribel Salcedo
Purchase Details
Closed on
Jan 4, 2011
Sold by
Citimortgage Inc
Bought by
The Secretary Of Housing & Urban Develop
Purchase Details
Closed on
May 14, 2010
Sold by
Callahan Shannon W and Johnson Callahan Gabriella L
Bought by
Citimortgage Inc
Create a Home Valuation Report for This Property
The Home Valuation Report is an in-depth analysis detailing your home's value as well as a comparison with similar homes in the area
Home Values in the Area
Average Home Value in this Area
Purchase History
| Date | Buyer | Sale Price | Title Company |
|---|---|---|---|
| Barber Trevor D | $147,200 | North American Title | |
| Tello Jose Luis Gonzalez | -- | Northwest Title Agency Inc | |
| The Secretary Of Housing & Urban Develop | -- | None Available | |
| Citimortgage Inc | $115,484 | None Available |
Source: Public Records
Mortgage History
| Date | Status | Borrower | Loan Amount |
|---|---|---|---|
| Open | Barber Trevor D | $148,686 |
Source: Public Records
Tax History Compared to Growth
Tax History
| Year | Tax Paid | Tax Assessment Tax Assessment Total Assessment is a certain percentage of the fair market value that is determined by local assessors to be the total taxable value of land and additions on the property. | Land | Improvement |
|---|---|---|---|---|
| 2025 | $2,306 | $179,400 | $17,300 | $162,100 |
| 2024 | $2,186 | $177,900 | $25,500 | $152,400 |
| 2023 | $2,210 | $162,000 | $20,400 | $141,600 |
| 2022 | $1,516 | $157,300 | $19,400 | $137,900 |
| 2021 | $1,382 | $106,624 | $17,444 | $89,180 |
| 2020 | $1,388 | $98,686 | $17,444 | $81,242 |
| 2019 | $1,058 | $95,844 | $17,444 | $78,400 |
| 2018 | $1,178 | $82,614 | $14,994 | $67,620 |
| 2017 | $1,444 | $88,886 | $12,446 | $76,440 |
| 2016 | $1,478 | $81,732 | $12,446 | $69,286 |
| 2015 | -- | $0 | $0 | $0 |
| 2014 | -- | $0 | $0 | $0 |
Source: Public Records
Map
Nearby Homes
- 510 Maple Dr
- 246 Beech Ave
- 70 Aspen Highland Place
- 316 E Pearl St
- 808 Cherry St
- 244 E Fremont St
- 531 E Main St
- 358 E Main St
- 525 E Main St
- 231 E Pearl St
- 611 NE Mineral Sp Rd
- 527 E Academy St
- 516 E School St
- 248 E School St
- 234 E School St
- 613 E University St
- 1130 E School St
- 13 Augusta Place
- 604 Prospect St
- 604 S Elm Ave
- 500 E Rose St
- 411 Chestnut Ave
- 548 E Rose St
- 537 537 Rose-Street-e
- 537 E Rose St
- 423 Chestnut Ave
- 539 E Rose St
- 408 Chestnut Ave
- 414 Chestnut Ave
- 545 E Rose St
- 427 Chestnut Ave
- 549 E Rose St
- 418 Chestnut Ave
- 555 E Rose St
- 564 E Rose St
- 435 Chestnut Ave
- 422 Chestnut Ave
- 411 N Pine Ave
- 411 N Pine Ave
- 547 Cherry St