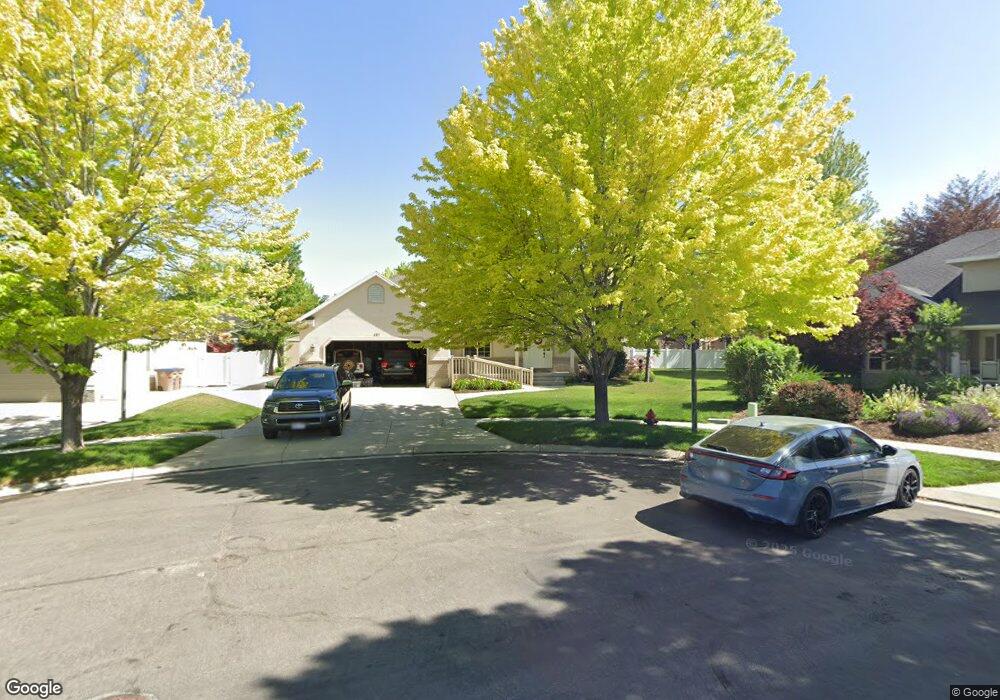
407 Clear Berry Cir Draper, UT 84020
Estimated Value: $726,000 - $943,000
4
Beds
3
Baths
2,272
Sq Ft
$346/Sq Ft
Est. Value
About This Home
This home is located at 407 Clear Berry Cir, Draper, UT 84020 and is currently estimated at $786,501, approximately $346 per square foot. 407 Clear Berry Cir is a home located in Salt Lake County with nearby schools including Crescent School, Mount Jordan Middle School, and St John the Baptist Catholic Elementary School.
Ownership History
Date
Name
Owned For
Owner Type
Purchase Details
Closed on
Nov 20, 2025
Sold by
Jones Mark Steven and Jones Michelle Jackson
Bought by
Mark And Michelle Jones Family Living Trust and Jones
Current Estimated Value
Home Financials for this Owner
Home Financials are based on the most recent Mortgage that was taken out on this home.
Original Mortgage
$400,000
Outstanding Balance
$400,000
Interest Rate
5.53%
Mortgage Type
Credit Line Revolving
Estimated Equity
$386,501
Purchase Details
Closed on
Sep 6, 2024
Sold by
Jones Mark Steven and Jones Michelle Jackson
Bought by
Mark And Michelle Jones Family Living Trust and Jones
Home Financials for this Owner
Home Financials are based on the most recent Mortgage that was taken out on this home.
Original Mortgage
$250,000
Interest Rate
6.73%
Mortgage Type
Credit Line Revolving
Purchase Details
Closed on
Jun 16, 2014
Sold by
Jones Mark S and Jones Michelle J
Bought by
Mark And Michelle Jones Family Living Ru and Jones Michelle J
Purchase Details
Closed on
Apr 25, 1997
Sold by
J And J & Sons Construction Company
Bought by
Jones Mark S and Jones Michelle J
Home Financials for this Owner
Home Financials are based on the most recent Mortgage that was taken out on this home.
Original Mortgage
$130,000
Interest Rate
7.86%
Create a Home Valuation Report for This Property
The Home Valuation Report is an in-depth analysis detailing your home's value as well as a comparison with similar homes in the area
Home Values in the Area
Average Home Value in this Area
Purchase History
| Date | Buyer | Sale Price | Title Company |
|---|---|---|---|
| Mark And Michelle Jones Family Living Trust | -- | Eagle Gate Title Insurance Agc | |
| Jones Mark Steven | -- | Eagle Gate Title Insurance Agc | |
| Mark And Michelle Jones Family Living Trust | -- | Eagle Gate Title Insurance Agc | |
| Jones Mark Steven | -- | Eagle Gate Title Insurance Agc | |
| Mark And Michelle Jones Family Living Ru | -- | None Available | |
| Jones Mark S | -- | First American Title |
Source: Public Records
Mortgage History
| Date | Status | Borrower | Loan Amount |
|---|---|---|---|
| Open | Jones Mark Steven | $400,000 | |
| Previous Owner | Jones Mark Steven | $250,000 | |
| Previous Owner | Jones Mark S | $130,000 |
Source: Public Records
Tax History
| Year | Tax Paid | Tax Assessment Tax Assessment Total Assessment is a certain percentage of the fair market value that is determined by local assessors to be the total taxable value of land and additions on the property. | Land | Improvement |
|---|---|---|---|---|
| 2025 | $3,378 | $664,700 | $233,000 | $431,700 |
| 2024 | $3,378 | $643,800 | $224,400 | $419,400 |
| 2023 | $3,348 | $633,300 | $219,200 | $414,100 |
| 2022 | $3,520 | $643,200 | $214,900 | $428,300 |
| 2021 | $3,023 | $471,700 | $202,500 | $269,200 |
| 2020 | $2,899 | $428,900 | $182,300 | $246,600 |
| 2019 | $2,965 | $428,600 | $182,300 | $246,300 |
| 2018 | $2,800 | $413,500 | $182,300 | $231,200 |
| 2017 | $2,709 | $383,300 | $173,500 | $209,800 |
| 2016 | $2,657 | $365,300 | $166,600 | $198,700 |
| 2015 | $2,787 | $354,800 | $176,600 | $178,200 |
| 2014 | $2,595 | $322,700 | $163,300 | $159,400 |
Source: Public Records
Map
Nearby Homes
- 622 Wyngate Pointe Ln
- 11737 S Nigel Peak Ln
- 654 Wyngate Pointe Ln
- 622 E Sawback Ln
- 11685 S Auburn Fields Way
- 468 E Montana Dr
- 276 E Hidden View Dr Unit 98
- 272 Hidden View Dr Unit 97
- 264 E Crescentwood Dr Unit 256
- 11743 S 700 E
- 11856 Cottage Side Way
- 11313 S 265 E
- 186 E Kimballfield Ln
- 11310 S 265 E Unit 217
- 11270 S Farnsworth Ln
- 11290 S 265 E Unit 212
- 244 E Crescent Park Way Unit 206
- 11362 S Crescent Park Cir Unit 8
- 11265 S Crescent Park Cir
- 205 Rockey Park Ln
- 413 Clear Berry Cir
- 414 Mountain Berry Dr
- 414 E Mountain Berry Dr
- 395 Clear Berry Cir
- 426 Mountain Berry Dr
- 402 Mountain Berry Dr
- 402 E Mountain Berry Dr
- 412 Clear Berry Cir
- 412 E Clear Berry Cir
- 445 Mapleberry Ct
- 438 Mountain Berry Dr
- 388 Mountain Berry Dr
- 388 E Mountain Berry Dr
- 385 Clear Berry Cir
- 404 Clear Berry Cir
- 442 Mapleberry Ct
- 392 Clear Berry Cir
- 453 Mapleberry Ct
- 452 Mountain Berry Dr
- 452 E Mountain Berry Dr
Your Personal Tour Guide
Ask me questions while you tour the home.