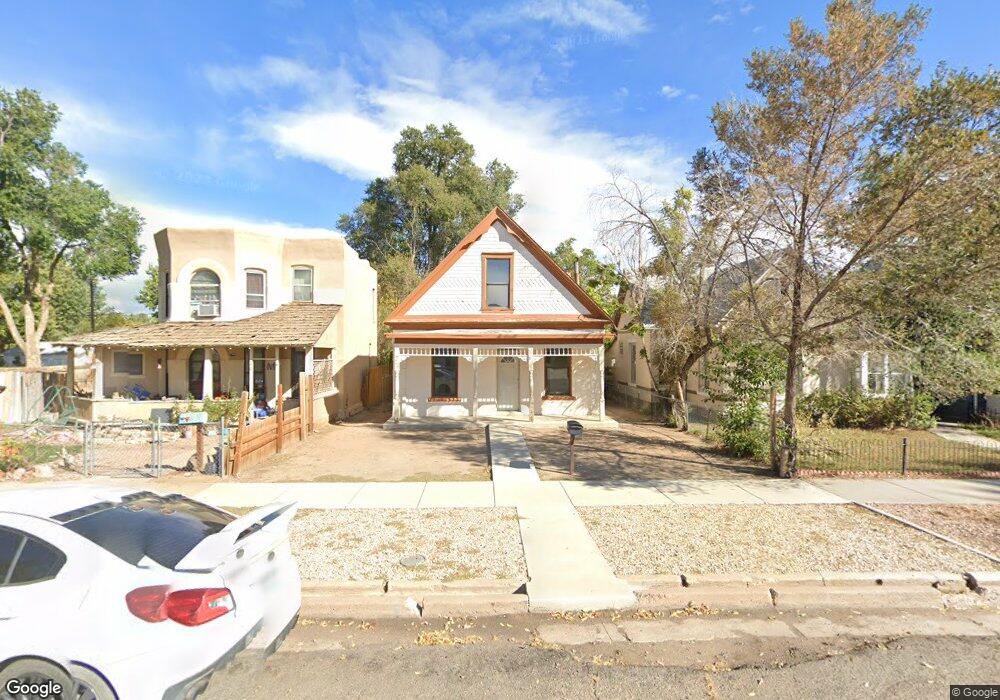
407 E 2nd St Florence, CO 81226
Estimated Value: $175,000 - $262,000
3
Beds
2
Baths
1,460
Sq Ft
$143/Sq Ft
Est. Value
About This Home
This home is located at 407 E 2nd St, Florence, CO 81226 and is currently estimated at $209,283, approximately $143 per square foot. 407 E 2nd St is a home located in Fremont County with nearby schools including Fremont Elementary School, Florence High School, and Florence Christian School.
Ownership History
Date
Name
Owned For
Owner Type
Purchase Details
Closed on
Mar 3, 2020
Sold by
Mcguire Susanna K
Bought by
D A M Partners Lllp
Current Estimated Value
Purchase Details
Closed on
Jun 22, 2005
Sold by
Poe William
Bought by
Mcguire Susanna K
Home Financials for this Owner
Home Financials are based on the most recent Mortgage that was taken out on this home.
Original Mortgage
$77,200
Interest Rate
7.95%
Mortgage Type
Adjustable Rate Mortgage/ARM
Purchase Details
Closed on
Jan 10, 2005
Sold by
Federal National Mortgage Association
Bought by
Poe William
Home Financials for this Owner
Home Financials are based on the most recent Mortgage that was taken out on this home.
Original Mortgage
$628
Interest Rate
5.68%
Mortgage Type
Unknown
Create a Home Valuation Report for This Property
The Home Valuation Report is an in-depth analysis detailing your home's value as well as a comparison with similar homes in the area
Home Values in the Area
Average Home Value in this Area
Tax History
| Year | Tax Paid | Tax Assessment Tax Assessment Total Assessment is a certain percentage of the fair market value that is determined by local assessors to be the total taxable value of land and additions on the property. | Land | Improvement |
|---|---|---|---|---|
| 2025 | $701 | $8,836 | -- | -- |
| 2024 | $701 | $9,077 | $0 | $0 |
| 2023 | $430 | $5,392 | $0 | $0 |
| 2022 | $565 | $7,146 | $0 | $0 |
| 2021 | $573 | $7,351 | $0 | $0 |
| 2020 | $658 | $9,747 | $0 | $0 |
| 2019 | $664 | $9,747 | $0 | $0 |
| 2018 | $550 | $8,155 | $0 | $0 |
| 2017 | $556 | $8,155 | $0 | $0 |
| 2016 | $472 | $6,930 | $0 | $0 |
| 2015 | $468 | $6,930 | $0 | $0 |
| 2012 | $488 | $6,591 | $678 | $5,913 |
Source: Public Records
Map
Nearby Homes
Your Personal Tour Guide
Ask me questions while you tour the home.