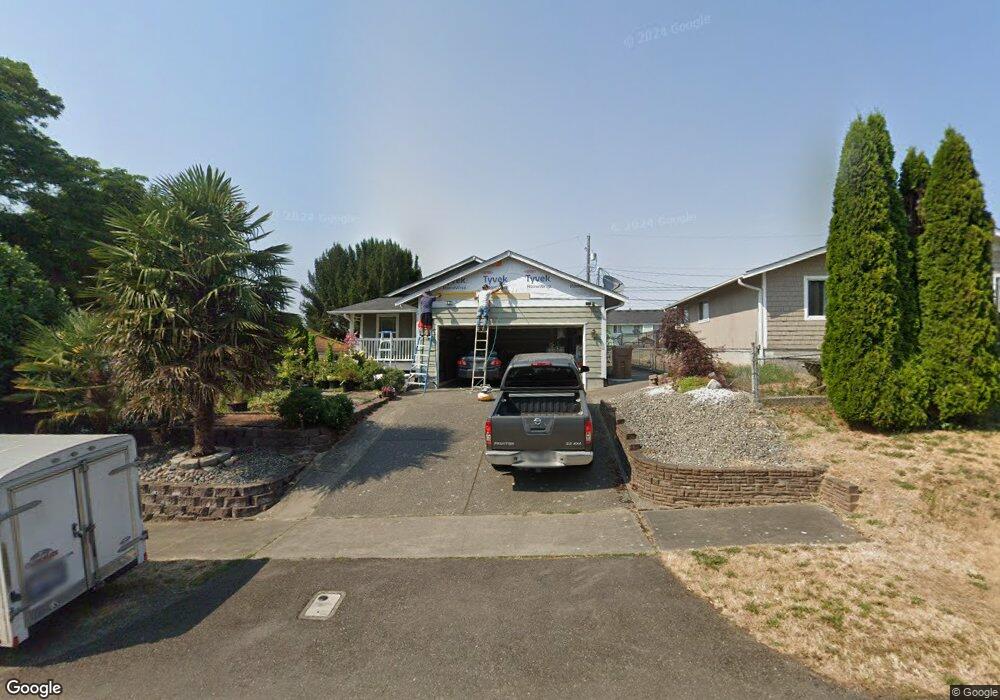
407 E 62nd St Tacoma, WA 98404
Eastside NeighborhoodEstimated Value: $455,000 - $486,000
3
Beds
2
Baths
1,294
Sq Ft
$363/Sq Ft
Est. Value
About This Home
This home is located at 407 E 62nd St, Tacoma, WA 98404 and is currently estimated at $470,320, approximately $363 per square foot. 407 E 62nd St is a home located in Pierce County with nearby schools including Oakland High School, Hunt Middle School, and Mount Tahoma High School.
Ownership History
Date
Name
Owned For
Owner Type
Purchase Details
Closed on
Nov 10, 2011
Sold by
Millheisler Christopher A and Millheisler Amanda J
Bought by
Dinh Canh and Ho Vivian
Current Estimated Value
Home Financials for this Owner
Home Financials are based on the most recent Mortgage that was taken out on this home.
Original Mortgage
$100,000
Outstanding Balance
$67,694
Interest Rate
3.87%
Mortgage Type
New Conventional
Estimated Equity
$402,626
Purchase Details
Closed on
Jan 21, 2008
Sold by
Carriage House Development Inc
Bought by
Millheisler Christopher A and Millheisler Amanda J
Home Financials for this Owner
Home Financials are based on the most recent Mortgage that was taken out on this home.
Original Mortgage
$198,550
Interest Rate
6.09%
Mortgage Type
Purchase Money Mortgage
Purchase Details
Closed on
Oct 22, 2007
Sold by
Burich Rose L
Bought by
Carriage House Development Inc
Home Financials for this Owner
Home Financials are based on the most recent Mortgage that was taken out on this home.
Original Mortgage
$178,000
Interest Rate
6.27%
Mortgage Type
Construction
Purchase Details
Closed on
Dec 30, 2003
Sold by
Burich Myles
Bought by
Burich Rose L
Home Financials for this Owner
Home Financials are based on the most recent Mortgage that was taken out on this home.
Original Mortgage
$15,000
Interest Rate
5.81%
Mortgage Type
Credit Line Revolving
Purchase Details
Closed on
Dec 29, 2003
Sold by
Fitzgerald Ruby Lois
Bought by
Burich Rose L and Trailor Ralph E
Home Financials for this Owner
Home Financials are based on the most recent Mortgage that was taken out on this home.
Original Mortgage
$15,000
Interest Rate
5.81%
Mortgage Type
Credit Line Revolving
Purchase Details
Closed on
Apr 17, 2002
Sold by
Trailor Ralph E
Bought by
Burich Rose L and Trailor Ralph E
Purchase Details
Closed on
Dec 6, 1995
Sold by
Fitzgerald Ruby Lois
Bought by
Fitzgerald Ruby Lois and Ruby Lois Fitzgerald Revocable Living Tr
Purchase Details
Closed on
Nov 29, 1995
Sold by
Fitzgerald Howard Lee
Bought by
Fitzgerald Ruby Lois
Create a Home Valuation Report for This Property
The Home Valuation Report is an in-depth analysis detailing your home's value as well as a comparison with similar homes in the area
Home Values in the Area
Average Home Value in this Area
Purchase History
| Date | Buyer | Sale Price | Title Company |
|---|---|---|---|
| Dinh Canh | $125,000 | None Available | |
| Millheisler Christopher A | $209,000 | Fatco | |
| Carriage House Development Inc | $72,500 | Fatco | |
| Burich Rose L | -- | Puget Sound Title Company | |
| Burich Rose L | -- | Puget Sound Title Company | |
| Burich Rose L | -- | Chicago Title Insurance Comp | |
| Fitzgerald Ruby Lois | -- | -- | |
| Fitzgerald Ruby Lois | -- | -- |
Source: Public Records
Mortgage History
| Date | Status | Borrower | Loan Amount |
|---|---|---|---|
| Open | Dinh Canh | $100,000 | |
| Previous Owner | Millheisler Christopher A | $198,550 | |
| Previous Owner | Carriage House Development Inc | $178,000 | |
| Previous Owner | Burich Rose L | $15,000 |
Source: Public Records
Tax History
| Year | Tax Paid | Tax Assessment Tax Assessment Total Assessment is a certain percentage of the fair market value that is determined by local assessors to be the total taxable value of land and additions on the property. | Land | Improvement |
|---|---|---|---|---|
| 2025 | $4,608 | $474,600 | $189,000 | $285,600 |
| 2024 | $4,608 | $443,100 | $182,100 | $261,000 |
| 2023 | $4,608 | $413,800 | $173,400 | $240,400 |
| 2022 | $4,429 | $454,200 | $162,200 | $292,000 |
| 2021 | $4,046 | $321,800 | $103,300 | $218,500 |
| 2019 | $3,431 | $292,200 | $85,400 | $206,800 |
| 2018 | $3,670 | $263,900 | $69,100 | $194,800 |
| 2017 | $3,266 | $232,300 | $55,300 | $177,000 |
| 2016 | $2,837 | $174,600 | $41,400 | $133,200 |
| 2014 | $2,327 | $163,100 | $39,000 | $124,100 |
| 2013 | $2,327 | $135,500 | $34,400 | $101,100 |
Source: Public Records
Map
Nearby Homes