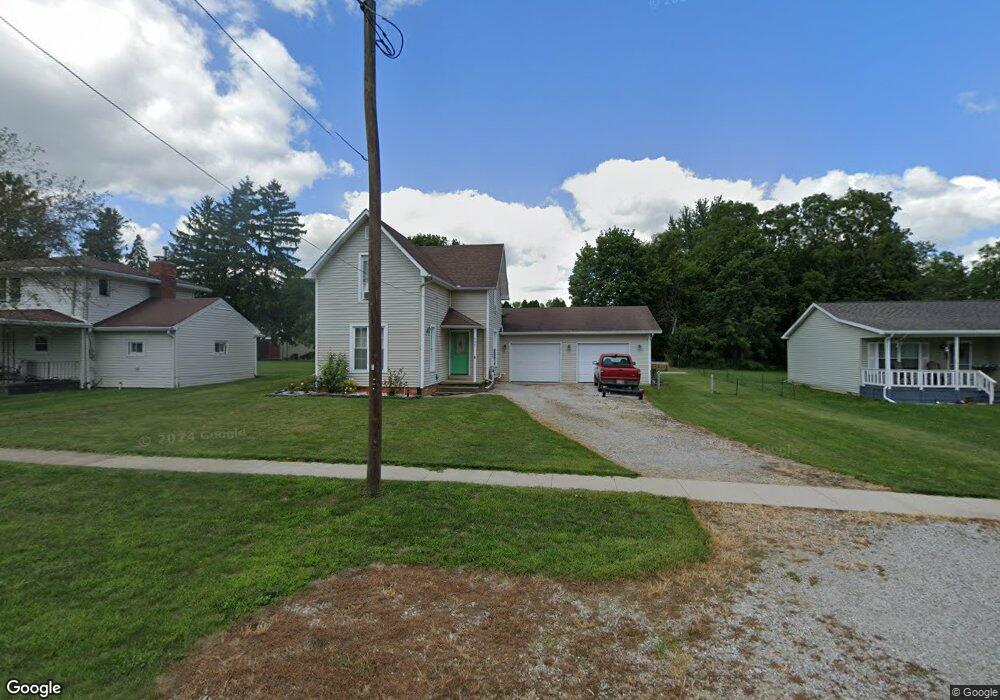
407 E Church St West Unity, OH 43570
Estimated Value: $144,000 - $178,000
4
Beds
2
Baths
1,552
Sq Ft
$104/Sq Ft
Est. Value
About This Home
This home is located at 407 E Church St, West Unity, OH 43570 and is currently estimated at $160,746, approximately $103 per square foot. 407 E Church St is a home located in Williams County with nearby schools including Hilltop Elementary School and Hilltop High School.
Ownership History
Date
Name
Owned For
Owner Type
Purchase Details
Closed on
Aug 9, 2023
Sold by
Klopfenstein Clifford D and Klopfenstein Carolyn Y
Bought by
Clifford D Klopfenstein And Carolyn Y Klopfen and Dietrich
Current Estimated Value
Purchase Details
Closed on
Oct 23, 2007
Sold by
Federal Home Loan Mortgage Corporation
Bought by
Klopfenstein Clifford D and Klopfenstein Carolyn Y
Purchase Details
Closed on
Jun 14, 2007
Sold by
Revas Esteban
Bought by
Federal Home Loan Mortgage Corp
Purchase Details
Closed on
Apr 5, 2001
Sold by
Dickinson Kent R and Dickinson Lillemon Todd G
Bought by
Rivas Esteban and Rivas Chanebra
Purchase Details
Closed on
Aug 16, 2000
Sold by
Hupe Michael and Hupe Rhonda L
Bought by
Dickinson Kent R and Dickinson Lillemon Todd
Purchase Details
Closed on
Sep 4, 1992
Bought by
Hupe Michael and Hupe Rhonda L
Create a Home Valuation Report for This Property
The Home Valuation Report is an in-depth analysis detailing your home's value as well as a comparison with similar homes in the area
Purchase History
We collect this data history from publicly available records. To have your information removed, we recommend requesting removal directly through your county’s website.
| Date | Buyer | Sale Price | Title Company |
|---|---|---|---|
| Clifford D Klopfenstein And Carolyn Y Klopfen | $125 | None Listed On Document | |
| Klopfenstein Clifford D | $65,000 | None Available | |
| Federal Home Loan Mortgage Corp | $63,500 | None Available | |
| Rivas Esteban | $98,000 | -- | |
| Dickinson Kent R | $31,000 | -- | |
| Hupe Michael | $37,000 | -- |
Source: Public Records
Tax History
| Year | Tax Paid | Tax Assessment Tax Assessment Total Assessment is a certain percentage of the fair market value that is determined by local assessors to be the total taxable value of land and additions on the property. | Land | Improvement |
|---|---|---|---|---|
| 2025 | $1,622 | $40,150 | $4,240 | $35,910 |
| 2024 | $1,622 | $40,150 | $4,240 | $35,910 |
| 2023 | $1,650 | $33,470 | $4,240 | $29,230 |
| 2022 | $1,635 | $33,470 | $4,240 | $29,230 |
| 2021 | $1,635 | $33,470 | $4,240 | $29,230 |
| 2020 | $1,449 | $28,600 | $3,610 | $24,990 |
| 2019 | $1,426 | $28,600 | $3,610 | $24,990 |
| 2018 | $1,344 | $28,600 | $3,610 | $24,990 |
| 2017 | $1,305 | $25,940 | $3,430 | $22,510 |
| 2016 | $1,246 | $25,940 | $3,430 | $22,510 |
| 2015 | $1,421 | $25,940 | $3,430 | $22,510 |
| 2014 | $1,421 | $27,310 | $3,610 | $23,700 |
| 2013 | $1,403 | $27,310 | $3,610 | $23,700 |
Source: Public Records
Map
Nearby Homes
- 402 N Liberty St
- 108 E Rings St
- 000 W Jackson
- 502 N Lincoln St
- 611 W Jackson St
- 111 Leigh Rd
- 22227 Us Highway 20a
- 21184 20n Rd Unit Tract 1
- 21184 20n Rd Unit Tract 3
- 20-n Road Unit Tract 2
- 9019 County Road 19-50
- 8906 County Road 21
- 16806 US Highway 20a Unit 20 & 24
- 16806 U S 20a
- 8437 18 Rd
- 14640 U S 20a
- 102 W Lynn St
- 106 W Lynn St
- 301 Horton St
- 314 W Curtis St
- 405 E Church St
- 409 E Church St Unit AB
- 409 E Church St
- 401 E Church St
- 410 E Church St
- 406 E Church St
- 210 Jefferson St
- 307 E Church St
- 504 E Church St
- 308 E Church St
- 405 E North St
- 415 E North St Unit 24
- 415 E North St
- 501 E Church St
- 407 E North St
- 403 E North St
- 201 Jefferson St
- 306 E Church St
- 310 N Liberty St
- 207 Maple St
Your Personal Tour Guide
Ask me questions while you tour the home.