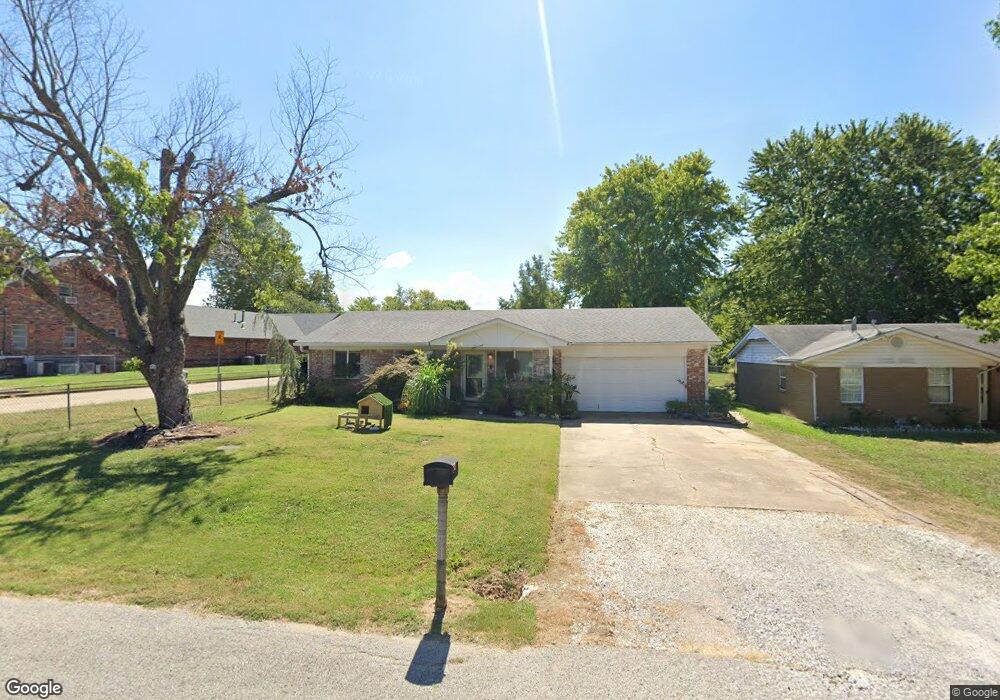
407 E Fry Ct Claremore, OK 74017
Estimated Value: $143,000 - $160,000
3
Beds
2
Baths
1,244
Sq Ft
$121/Sq Ft
Est. Value
About This Home
This home is located at 407 E Fry Ct, Claremore, OK 74017 and is currently estimated at $151,112, approximately $121 per square foot. 407 E Fry Ct is a home located in Rogers County with nearby schools including Claremont Elementary School, Will Rogers Junior High School, and Claremore High School.
Ownership History
Date
Name
Owned For
Owner Type
Purchase Details
Closed on
Aug 30, 2019
Sold by
Troyer Investments Llc
Bought by
Baker Jennifer Lynn
Current Estimated Value
Home Financials for this Owner
Home Financials are based on the most recent Mortgage that was taken out on this home.
Original Mortgage
$84,932
Outstanding Balance
$75,873
Interest Rate
4.62%
Mortgage Type
FHA
Estimated Equity
$75,239
Purchase Details
Closed on
Jun 21, 2012
Sold by
Yurkosky Joel L and Yurkosky Rachael L
Bought by
Troyer Investments Llc
Purchase Details
Closed on
Oct 27, 2011
Sold by
Raleigh Gary D and Raleigh Brenda
Bought by
Yurkosky Joel L and Eggiman Rachael L
Home Financials for this Owner
Home Financials are based on the most recent Mortgage that was taken out on this home.
Original Mortgage
$65,301
Interest Rate
4.12%
Mortgage Type
FHA
Purchase Details
Closed on
Apr 2, 1998
Sold by
Raffety Martha
Create a Home Valuation Report for This Property
The Home Valuation Report is an in-depth analysis detailing your home's value as well as a comparison with similar homes in the area
Home Values in the Area
Average Home Value in this Area
Purchase History
| Date | Buyer | Sale Price | Title Company |
|---|---|---|---|
| Baker Jennifer Lynn | $86,500 | Firstitle & Abstract Svcs Ll | |
| Troyer Investments Llc | $66,000 | First American Title & Abstr | |
| Yurkosky Joel L | $67,000 | None Available | |
| -- | $65,500 | -- |
Source: Public Records
Mortgage History
| Date | Status | Borrower | Loan Amount |
|---|---|---|---|
| Open | Baker Jennifer Lynn | $84,932 | |
| Previous Owner | Yurkosky Joel L | $65,301 |
Source: Public Records
Tax History
| Year | Tax Paid | Tax Assessment Tax Assessment Total Assessment is a certain percentage of the fair market value that is determined by local assessors to be the total taxable value of land and additions on the property. | Land | Improvement |
|---|---|---|---|---|
| 2025 | $858 | $10,280 | $2,039 | $8,241 |
| 2024 | $830 | $9,981 | $1,980 | $8,001 |
| 2023 | $830 | $9,689 | $1,803 | $7,886 |
| 2022 | $778 | $9,408 | $1,540 | $7,868 |
| 2021 | $774 | $9,769 | $1,540 | $8,229 |
| 2020 | $789 | $9,613 | $1,540 | $8,073 |
| 2019 | $671 | $7,241 | $1,540 | $5,701 |
| 2018 | $723 | $7,827 | $1,540 | $6,287 |
| 2017 | $713 | $7,766 | $1,540 | $6,226 |
| 2016 | $711 | $7,580 | $1,540 | $6,040 |
| 2015 | $686 | $7,400 | $1,540 | $5,860 |
| 2014 | $710 | $7,658 | $1,540 | $6,118 |
Source: Public Records
Map
Nearby Homes
- 303 E Fry Place
- 1007 S Choctaw Place
- 620 S Choctaw Ave
- 117 W 9th Place S
- 116 W 11th St
- 121 W 9th Place S
- 507 S Maryland Ave
- 321 E Patti Page Blvd
- 402 E Patti Page Blvd
- 430 E Will Rogers Blvd
- 321 E 4th St
- 212 N Lavira Ave
- 21755 Country Ridge Ln
- 614 E 5th St
- 411 E 6th St
- 221 N Dorothy Ave
- 401 E Patti Page Blvd
- 402 E 6th St
- 403 N Choctaw Ave
- 2010 S Missouri Ave
- 405 E Fry Ct
- 903 S Wewoka Ave
- 403 E Fry Ct
- 806 S Choctaw Place
- 905 S Wewoka Ave
- 904 S Choctaw Place
- 401 E Fry Ct
- 906 S Choctaw Place
- 907 S Wewoka Ave
- 804 S Choctaw Place
- 320 E Fry Ct
- 908 S Choctaw Place
- 908 S Wewoka Ave
- 317 E Fry Ct
- 909 S Wewoka Ave
- 314 E Fry Ct
- 802 S Choctaw Place
- 910 S Wewoka Ave
- 903 S Choctaw Place
- 1001 S Wewoka Ave
Your Personal Tour Guide
Ask me questions while you tour the home.