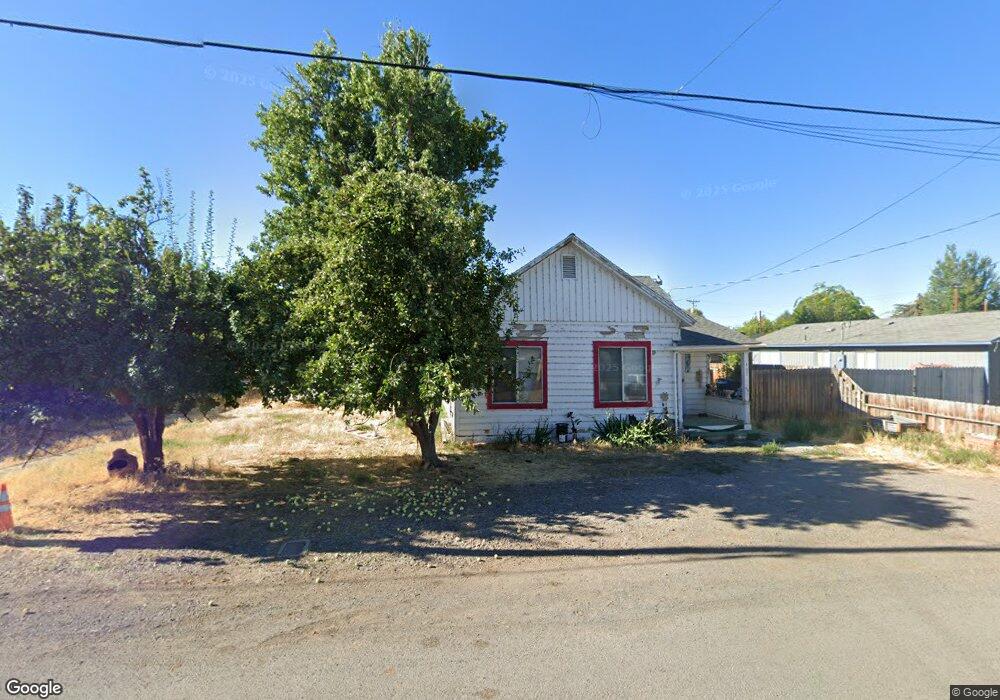
407 E Modoc St Alturas, CA 96101
Estimated Value: $105,000 - $126,000
3
Beds
1
Bath
1,450
Sq Ft
$79/Sq Ft
Est. Value
About This Home
This home is located at 407 E Modoc St, Alturas, CA 96101 and is currently estimated at $115,233, approximately $79 per square foot. 407 E Modoc St is a home located in Modoc County with nearby schools including Modoc High School and New Day Academy.
Ownership History
Date
Name
Owned For
Owner Type
Purchase Details
Closed on
Mar 24, 2011
Sold by
Lindahl Beverly J
Bought by
Dewolf Ronald Clay and Dewolf Isabel Miriam
Current Estimated Value
Home Financials for this Owner
Home Financials are based on the most recent Mortgage that was taken out on this home.
Original Mortgage
$26,268
Outstanding Balance
$18,142
Interest Rate
4.9%
Mortgage Type
Seller Take Back
Estimated Equity
$97,091
Purchase Details
Closed on
Feb 17, 2011
Sold by
Wells Fargo Bank National Association
Bought by
Lindahl Beverly J
Home Financials for this Owner
Home Financials are based on the most recent Mortgage that was taken out on this home.
Original Mortgage
$26,268
Outstanding Balance
$18,142
Interest Rate
4.9%
Mortgage Type
Seller Take Back
Estimated Equity
$97,091
Purchase Details
Closed on
Jan 11, 2010
Sold by
Fox Mike
Bought by
Wells Fargo Bank National Association
Purchase Details
Closed on
Oct 28, 2003
Sold by
Nelson Eric M and Nelson Dena
Bought by
Fox Mike
Create a Home Valuation Report for This Property
The Home Valuation Report is an in-depth analysis detailing your home's value as well as a comparison with similar homes in the area
Home Values in the Area
Average Home Value in this Area
Purchase History
| Date | Buyer | Sale Price | Title Company |
|---|---|---|---|
| Dewolf Ronald Clay | $31,000 | Modoc County Title Co | |
| Lindahl Beverly J | $30,000 | Modoc County Title Company | |
| Wells Fargo Bank National Association | $77,171 | Accommodation | |
| Fox Mike | $63,000 | Modoc County Title Co |
Source: Public Records
Mortgage History
| Date | Status | Borrower | Loan Amount |
|---|---|---|---|
| Open | Dewolf Ronald Clay | $26,268 |
Source: Public Records
Tax History
| Year | Tax Paid | Tax Assessment Tax Assessment Total Assessment is a certain percentage of the fair market value that is determined by local assessors to be the total taxable value of land and additions on the property. | Land | Improvement |
|---|---|---|---|---|
| 2025 | $571 | $39,093 | $13,912 | $25,181 |
| 2024 | $571 | $38,328 | $13,640 | $24,688 |
| 2023 | $564 | $37,577 | $13,373 | $24,204 |
| 2022 | $556 | $36,841 | $13,111 | $23,730 |
| 2021 | $549 | $36,119 | $12,854 | $23,265 |
| 2020 | $546 | $35,750 | $12,723 | $23,027 |
| 2019 | $539 | $35,050 | $12,474 | $22,576 |
| 2018 | $532 | $34,364 | $12,230 | $22,134 |
| 2017 | $525 | $33,691 | $11,991 | $21,700 |
| 2016 | $518 | $33,031 | $11,756 | $21,275 |
| 2015 | $513 | $32,536 | $11,580 | $20,956 |
| 2014 | $507 | $31,900 | $11,354 | $20,546 |
Source: Public Records
Map
Nearby Homes
- 403 E Modoc St
- 409 E Modoc St
- 304 S Estes St
- 302 S Estes St
- 406 E Modoc St
- 404 E Modoc St
- 415 E Modoc St
- 402 E Modoc St
- 400 E Modoc St
- 312 S Estes St
- 410 E Modoc St
- 414 E Modoc St Unit 411
- 407 E North St
- 311 E Modoc St
- 405 E North St
- 403 E North St
- 418 E Modoc St
- 417 E Modoc St
- 202 S Estes St
- 310 E Modoc St
Your Personal Tour Guide
Ask me questions while you tour the home.