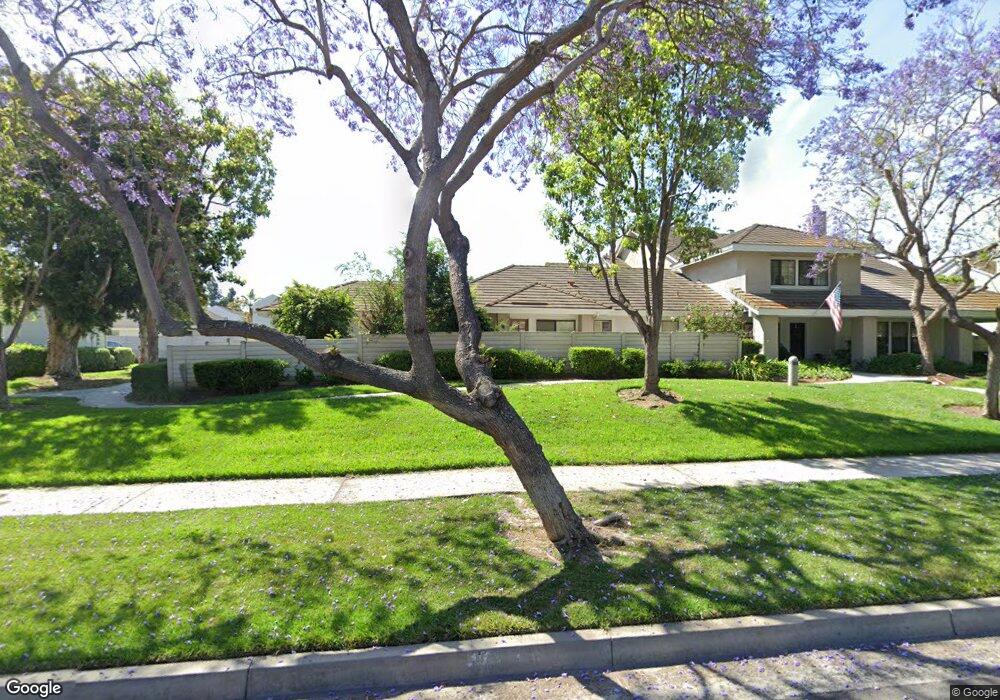
407 E Yale Loop Irvine, CA 92614
Woodbridge NeighborhoodEstimated Value: $970,062 - $1,091,000
2
Beds
2
Baths
1,290
Sq Ft
$786/Sq Ft
Est. Value
About This Home
This home is located at 407 E Yale Loop, Irvine, CA 92614 and is currently estimated at $1,013,516, approximately $785 per square foot. 407 E Yale Loop is a home located in Orange County with nearby schools including Springbrook Elementary School, South Lake Middle School, and Woodbridge High School.
Ownership History
Date
Name
Owned For
Owner Type
Purchase Details
Closed on
Dec 3, 2025
Sold by
Kim Min and Im Terry
Bought by
Dong Hto Im Revocable Trust and Im
Current Estimated Value
Purchase Details
Closed on
Nov 23, 2011
Sold by
Im Dong Ho
Bought by
Kim Min and Im Terry
Purchase Details
Closed on
Jul 13, 2005
Sold by
Im Dong Ho
Bought by
Im Dong Ho and Dong Ho Im Revocable Trust
Purchase Details
Closed on
Sep 5, 2000
Sold by
Helen Clark
Bought by
Im Dong Ho and Im Jung Ai
Purchase Details
Closed on
May 29, 1996
Sold by
Clark Helen M
Bought by
Clark Helen Mcmillan Dodge
Home Financials for this Owner
Home Financials are based on the most recent Mortgage that was taken out on this home.
Original Mortgage
$129,500
Interest Rate
7.97%
Purchase Details
Closed on
May 3, 1996
Sold by
Anderson Michael J and Anderson Barbara Jill
Bought by
Clark Helen M
Home Financials for this Owner
Home Financials are based on the most recent Mortgage that was taken out on this home.
Original Mortgage
$129,500
Interest Rate
7.97%
Create a Home Valuation Report for This Property
The Home Valuation Report is an in-depth analysis detailing your home's value as well as a comparison with similar homes in the area
Home Values in the Area
Average Home Value in this Area
Purchase History
| Date | Buyer | Sale Price | Title Company |
|---|---|---|---|
| Dong Hto Im Revocable Trust | -- | None Listed On Document | |
| Kim Min | -- | None Available | |
| Im Dong Ho | -- | -- | |
| Im Dong Ho | $275,000 | Orange Coast Title | |
| Clark Helen Mcmillan Dodge | -- | Old Republic Title Company | |
| Clark Helen M | $185,000 | Old Republic Title Company |
Source: Public Records
Mortgage History
| Date | Status | Borrower | Loan Amount |
|---|---|---|---|
| Previous Owner | Clark Helen M | $129,500 |
Source: Public Records
Tax History
| Year | Tax Paid | Tax Assessment Tax Assessment Total Assessment is a certain percentage of the fair market value that is determined by local assessors to be the total taxable value of land and additions on the property. | Land | Improvement |
|---|---|---|---|---|
| 2025 | $4,458 | $414,370 | $243,195 | $171,175 |
| 2024 | $4,458 | $406,246 | $238,427 | $167,819 |
| 2023 | $4,343 | $398,281 | $233,752 | $164,529 |
| 2022 | $4,257 | $390,472 | $229,169 | $161,303 |
| 2021 | $4,158 | $382,816 | $224,675 | $158,141 |
| 2020 | $4,135 | $378,891 | $222,371 | $156,520 |
| 2019 | $4,044 | $371,462 | $218,011 | $153,451 |
| 2018 | $3,971 | $364,179 | $213,736 | $150,443 |
| 2017 | $3,890 | $357,039 | $209,545 | $147,494 |
| 2016 | $3,721 | $350,039 | $205,437 | $144,602 |
| 2015 | $3,667 | $344,782 | $202,352 | $142,430 |
| 2014 | $3,597 | $338,029 | $198,389 | $139,640 |
Source: Public Records
Map
Nearby Homes
- 409 E Yale Loop Unit 16
- 411 E Yale Loop
- 413 E Yale Loop
- 42 Amberleaf
- 405 E Yale Loop Unit 18
- 405 E Yale Loop
- 415 E Yale Loop Unit 13
- 44 Amberleaf Unit 87
- 32 Amberleaf Unit 81
- 32 Amberleaf
- 403 E Yale Loop Unit 19
- 401 E Yale Loop
- 40 Amberleaf Unit 85
- 54 Amberleaf Unit 92
- 34 Amberleaf Unit 82
- 46 Amberleaf Unit 88
- 46 Amberleaf
- 30 Amberleaf
- 38 Amberleaf
- 48 Amberleaf
Your Personal Tour Guide
Ask me questions while you tour the home.