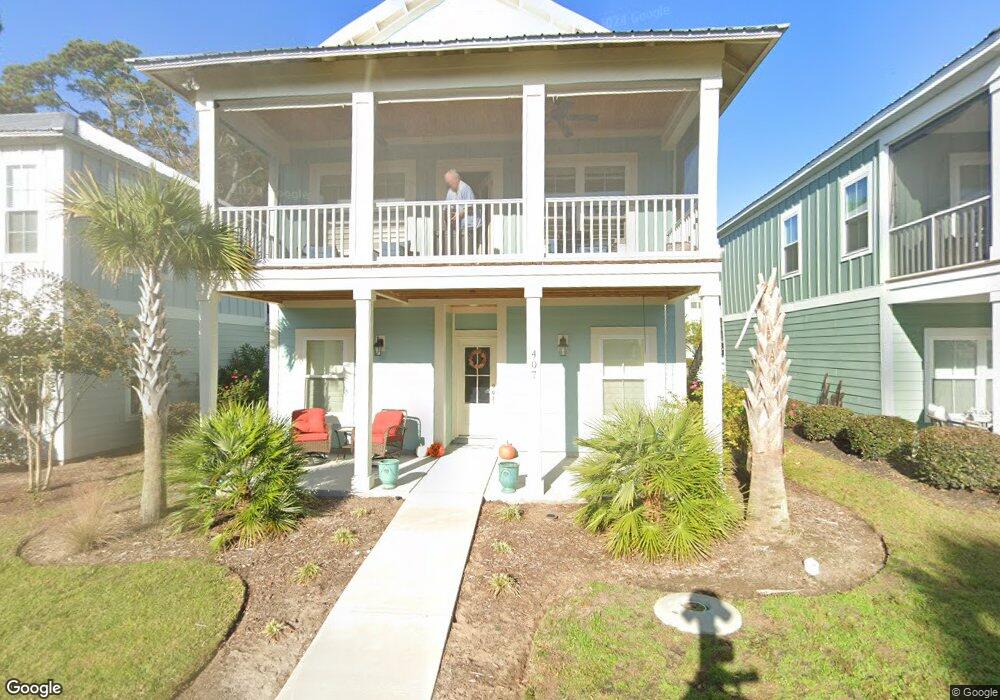
407 Lumbee Cir Unit LOT 102 Pawleys Island, SC 29585
Estimated Value: $537,046 - $562,000
3
Beds
3
Baths
1,768
Sq Ft
$309/Sq Ft
Est. Value
About This Home
This home is located at 407 Lumbee Cir Unit LOT 102, Pawleys Island, SC 29585 and is currently estimated at $546,762, approximately $309 per square foot. 407 Lumbee Cir Unit LOT 102 is a home located in Georgetown County with nearby schools including Waccamaw Elementary School, Waccamaw Intermediate School, and Waccamaw Middle School.
Ownership History
Date
Name
Owned For
Owner Type
Purchase Details
Closed on
Feb 22, 2024
Sold by
Native Homes Llc
Bought by
Hunter Family Llc
Current Estimated Value
Purchase Details
Closed on
Dec 6, 2021
Sold by
Richmond William D and Richmond William D
Bought by
Native Homes Llc
Purchase Details
Closed on
Jan 25, 2018
Sold by
John C Gianos
Bought by
Principe Pamela
Home Financials for this Owner
Home Financials are based on the most recent Mortgage that was taken out on this home.
Original Mortgage
$207,339
Interest Rate
4.15%
Purchase Details
Closed on
Jan 6, 2010
Sold by
Tom Catz Llc
Bought by
Richmond William D and William D Richmond Revocable Trust
Purchase Details
Closed on
Mar 25, 2008
Sold by
Willbrook Holdings Llc
Bought by
Tom Catz Llc
Create a Home Valuation Report for This Property
The Home Valuation Report is an in-depth analysis detailing your home's value as well as a comparison with similar homes in the area
Home Values in the Area
Average Home Value in this Area
Purchase History
| Date | Buyer | Sale Price | Title Company |
|---|---|---|---|
| Hunter Family Llc | $479,000 | None Listed On Document | |
| Native Homes Llc | $87,500 | None Available | |
| Principe Pamela | $339,900 | -- | |
| Richmond William D | $44,000 | -- | |
| Tom Catz Llc | $380,072 | Attorney |
Source: Public Records
Mortgage History
| Date | Status | Borrower | Loan Amount |
|---|---|---|---|
| Previous Owner | Principe Pamela | $207,339 | |
| Previous Owner | Principe Pamela | -- |
Source: Public Records
Tax History Compared to Growth
Tax History
| Year | Tax Paid | Tax Assessment Tax Assessment Total Assessment is a certain percentage of the fair market value that is determined by local assessors to be the total taxable value of land and additions on the property. | Land | Improvement |
|---|---|---|---|---|
| 2024 | $2,272 | $17,420 | $3,200 | $14,220 |
| 2023 | $2,272 | $27,030 | $4,800 | $22,230 |
| 2022 | $1,121 | $4,800 | $4,800 | $0 |
| 2021 | $687 | $0 | $0 | $0 |
| 2020 | $686 | $0 | $0 | $0 |
| 2019 | $593 | $0 | $0 | $0 |
| 2018 | $596 | $0 | $0 | $0 |
| 2017 | $556 | $0 | $0 | $0 |
| 2016 | $552 | $2,640 | $0 | $0 |
| 2015 | $531 | $0 | $0 | $0 |
| 2014 | $531 | $44,000 | $44,000 | $0 |
| 2012 | -- | $44,000 | $44,000 | $0 |
Source: Public Records
Map
Nearby Homes
- 399 Lumbee Cir
- 82 Mingo Dr Unit 3-B
- 220 Lumbee Cir Unit 34
- 48 Lumbee Cir Unit 8
- 138 Lumbee Cir Unit 17
- Portion Wall St
- 164 Boatmen Dr
- 74 Marsh Point Dr
- 41 Federation Loop Unit Reunion Hall
- 113 Lakeside Dr Unit A
- 40 Winston Cir
- 77 Tern Place Unit 202
- 14290 Ocean Hwy Unit 320
- 14290 Ocean Hwy Unit 201
- 14290 Ocean Hwy Unit 324
- 14290 Ocean Hwy Unit 220
- 14290 Ocean Hwy Unit 207
- 14290 Ocean Hwy Unit 211
- 39 Blue Crab Way Unit 21
- 27 Riptide Ln
- 407 Lumbee Cir
- 399 Lumbee Cir Unit The Hammocks at Ming
- 399 Lumbee Cir Unit LOT 102
- 415 Lumbee Cir Unit HAMMOCKS AT MINGO -
- 415 Lumbee Cir Unit The Hammocks at Ming
- 390 Lumbee Cir
- 406 Lumbee Cir Unit HAMMOCKS AT MINGO -
- 382 Lumbee Cir Unit The Hammocks at Ming
- 423 Lumbee Cir Unit The Hammocks at Ming
- 423 Lumbee Cir
- 374 Lumbee Cir
- 417 Lumbee Cir Unit 42
- Lot 119 Mingo
- Lot 126 Lumbee Cir
- Lot 118 Lumbee Cir
- 4 Lumbee Cir
- 4 Lumbee Cir Unit 28
- 4 Lumbee Cir Unit B
- 0 Mingo Dr Unit 2-E 1618393
- 0 Mingo Dr Unit 1-C 1618385