407 Maple Ave Morrison, IL 61270
Estimated Value: $160,000 - $206,000
3
Beds
2
Baths
1,355
Sq Ft
$138/Sq Ft
Est. Value
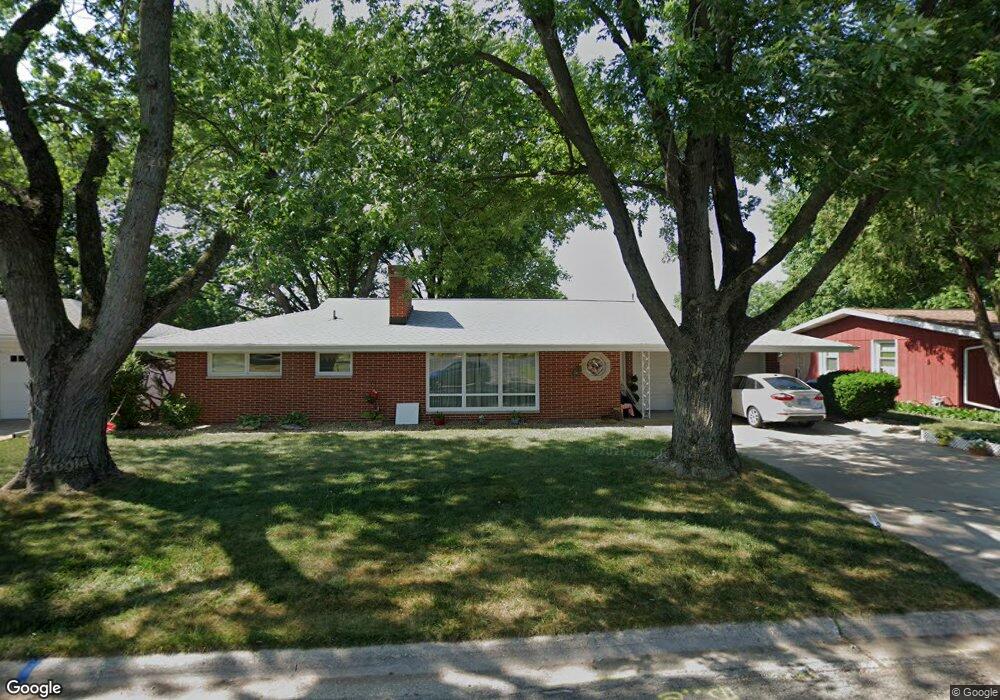
About This Home
This home is located at 407 Maple Ave, Morrison, IL 61270 and is currently estimated at $186,606, approximately $137 per square foot. 407 Maple Ave is a home located in Whiteside County with nearby schools including Northside School, Southside School, and Morrison Junior High School.
Ownership History
Date
Name
Owned For
Owner Type
Purchase Details
Closed on
Jul 24, 2015
Sold by
Kaufman Wade C
Bought by
Kaufman Jill Marie Friel and Schroeder Jill M
Current Estimated Value
Purchase Details
Closed on
Jun 14, 2006
Sold by
Wiersema Larry K and Wiersema Dale E
Bought by
Kaufman Wade C and Schroeder Jill M
Home Financials for this Owner
Home Financials are based on the most recent Mortgage that was taken out on this home.
Original Mortgage
$100,000
Outstanding Balance
$59,153
Interest Rate
6.68%
Mortgage Type
New Conventional
Estimated Equity
$127,453
Create a Home Valuation Report for This Property
The Home Valuation Report is an in-depth analysis detailing your home's value as well as a comparison with similar homes in the area
Home Values in the Area
Average Home Value in this Area
Purchase History
| Date | Buyer | Sale Price | Title Company |
|---|---|---|---|
| Kaufman Jill Marie Friel | -- | Sauk Valley Title | |
| Kaufman Wade C | $25,000 | None Available |
Source: Public Records
Mortgage History
| Date | Status | Borrower | Loan Amount |
|---|---|---|---|
| Open | Kaufman Wade C | $100,000 |
Source: Public Records
Tax History
| Year | Tax Paid | Tax Assessment Tax Assessment Total Assessment is a certain percentage of the fair market value that is determined by local assessors to be the total taxable value of land and additions on the property. | Land | Improvement |
|---|---|---|---|---|
| 2024 | $2,783 | $56,915 | $2,261 | $54,654 |
| 2023 | $2,850 | $51,816 | $2,058 | $49,758 |
| 2022 | $2,883 | $48,120 | $1,911 | $46,209 |
| 2021 | $2,868 | $47,121 | $1,871 | $45,250 |
| 2020 | $3,361 | $48,014 | $1,906 | $46,108 |
| 2019 | $3,540 | $49,715 | $1,974 | $47,741 |
| 2018 | $3,673 | $49,492 | $1,965 | $47,527 |
| 2017 | $3,385 | $47,543 | $1,888 | $45,655 |
| 2016 | $3,227 | $45,856 | $1,821 | $44,035 |
| 2015 | $358 | $46,976 | $1,866 | $45,110 |
| 2014 | $3,545 | $46,445 | $1,845 | $44,600 |
| 2013 | $358 | $46,976 | $1,866 | $45,110 |
Source: Public Records
Map
Nearby Homes
- 102 S Jackson St
- 101 N Jackson St
- 403 E Park St
- 503 Portland Ave
- 302 E Park St
- 304 S Madison St
- 400 E Knox St
- 109 E Morris St
- 00 N Jackson St
- 406 S Genesee St
- 308 S Genesee St
- 105 E Knox St
- 602 Glenwood Dr
- 523 Barden St
- 208 Johnson St
- 518 Barden St
- 516 Christopher St
- 805 Keith Dr
- 411 W Park St
- 402 W Lincolnway