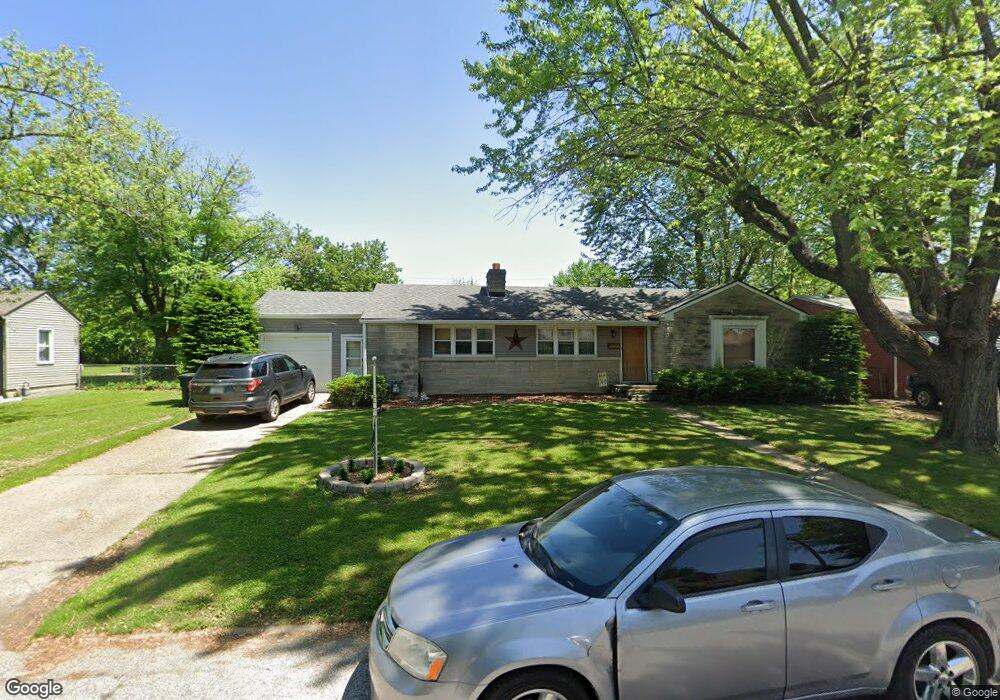
407 N 18th Ave Beech Grove, IN 46107
Estimated Value: $193,000 - $206,000
3
Beds
2
Baths
1,228
Sq Ft
$164/Sq Ft
Est. Value
About This Home
This home is located at 407 N 18th Ave, Beech Grove, IN 46107 and is currently estimated at $201,220, approximately $163 per square foot. 407 N 18th Ave is a home located in Marion County with nearby schools including Hornet Park Elementary School, Central Elementary School, and South Grove Intermediate School.
Ownership History
Date
Name
Owned For
Owner Type
Purchase Details
Closed on
Mar 17, 2017
Sold by
Beach Bartley W
Bought by
Beach Brent A
Current Estimated Value
Purchase Details
Closed on
Jun 26, 2009
Sold by
Livingston Debra J
Bought by
Beach Bartley W and Beach Anna E
Home Financials for this Owner
Home Financials are based on the most recent Mortgage that was taken out on this home.
Original Mortgage
$78,551
Interest Rate
5.32%
Mortgage Type
FHA
Purchase Details
Closed on
Jan 18, 2008
Sold by
Strykowski Helen M and Brown Ralph E
Bought by
Livingston Debra J
Home Financials for this Owner
Home Financials are based on the most recent Mortgage that was taken out on this home.
Original Mortgage
$89,900
Interest Rate
6.11%
Mortgage Type
Purchase Money Mortgage
Create a Home Valuation Report for This Property
The Home Valuation Report is an in-depth analysis detailing your home's value as well as a comparison with similar homes in the area
Home Values in the Area
Average Home Value in this Area
Purchase History
| Date | Buyer | Sale Price | Title Company |
|---|---|---|---|
| Beach Brent A | $90,000 | -- | |
| Beach Brent A | $90,000 | Chicago Title | |
| Beach Bartley W | -- | First American Title Ins Co | |
| Livingston Debra J | -- | Fat |
Source: Public Records
Mortgage History
| Date | Status | Borrower | Loan Amount |
|---|---|---|---|
| Previous Owner | Beach Bartley W | $78,551 | |
| Previous Owner | Livingston Debra J | $89,900 |
Source: Public Records
Tax History Compared to Growth
Tax History
| Year | Tax Paid | Tax Assessment Tax Assessment Total Assessment is a certain percentage of the fair market value that is determined by local assessors to be the total taxable value of land and additions on the property. | Land | Improvement |
|---|---|---|---|---|
| 2024 | $2,088 | $143,400 | $18,700 | $124,700 |
| 2023 | $2,088 | $157,000 | $18,700 | $138,300 |
| 2022 | $1,922 | $140,900 | $18,700 | $122,200 |
| 2021 | $1,538 | $118,900 | $18,700 | $100,200 |
| 2020 | $1,317 | $108,400 | $18,700 | $89,700 |
| 2019 | $1,141 | $98,100 | $14,100 | $84,000 |
| 2018 | $1,101 | $97,100 | $14,100 | $83,000 |
| 2017 | $699 | $90,100 | $14,100 | $76,000 |
| 2016 | $640 | $87,100 | $14,100 | $73,000 |
| 2014 | $503 | $84,800 | $14,100 | $70,700 |
| 2013 | $525 | $84,800 | $14,100 | $70,700 |
Source: Public Records
Map
Nearby Homes
- 349 N 17th Ave
- 415 N 17th Ave
- 301 N 17th Ave
- 1617 Capra Ct
- 1701 Southern Ave
- 258 N 16th Ave
- 1614 Capra Ct
- 1601 Southern Ave
- 2180 Cleveland St
- 2021 Prospect St
- 3603 Margaret Ave
- 437 N 13th Ave
- 2017 Ticen Ct
- 1115 Bethel Ave
- 2215 Albany St
- 1514 Main St
- 62 N 13th Ave
- 2832 S Oakland Ave
- 30 Gilbert Ave
- 2060 Alton St