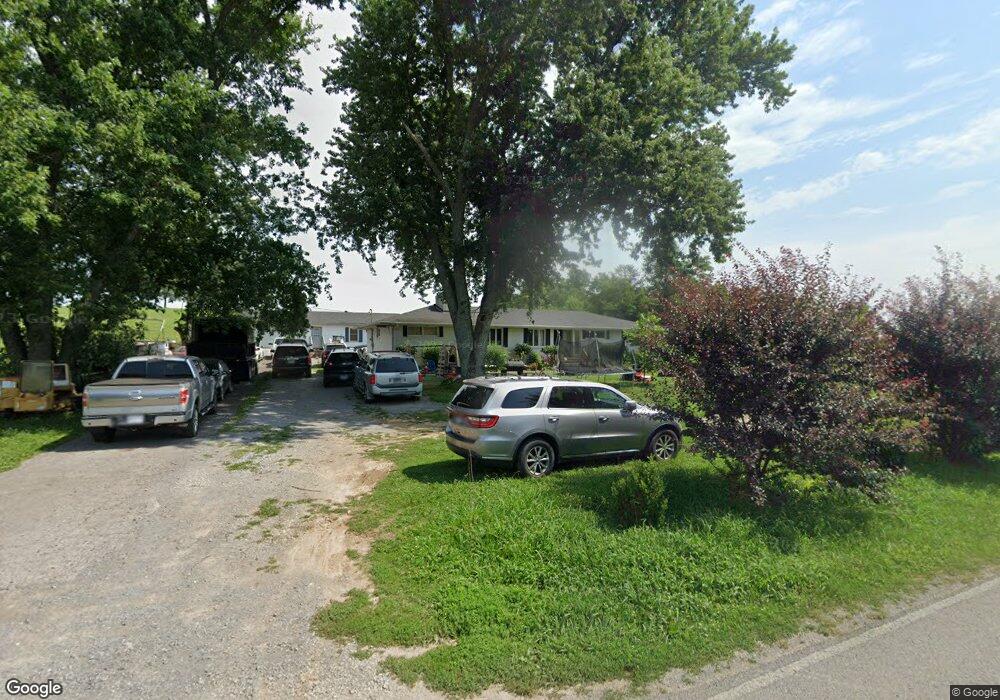
407 Naron Rd Shelbyville, TN 37160
Estimated Value: $337,000 - $399,000
3
Beds
2
Baths
1,630
Sq Ft
$222/Sq Ft
Est. Value
About This Home
This home is located at 407 Naron Rd, Shelbyville, TN 37160 and is currently estimated at $362,650, approximately $222 per square foot. 407 Naron Rd is a home located in Bedford County with nearby schools including Liberty Elementary School.
Ownership History
Date
Name
Owned For
Owner Type
Purchase Details
Closed on
Mar 3, 2017
Sold by
Orr Donna
Bought by
Flores Daniel Rios
Current Estimated Value
Home Financials for this Owner
Home Financials are based on the most recent Mortgage that was taken out on this home.
Original Mortgage
$159,556
Outstanding Balance
$130,868
Interest Rate
3.87%
Mortgage Type
FHA
Estimated Equity
$231,782
Purchase Details
Closed on
Jan 14, 2013
Sold by
Orr David Garland
Bought by
Orr Donna
Purchase Details
Closed on
Feb 15, 1996
Sold by
Orr Mildred N
Bought by
Orr David and Orr Vicki
Purchase Details
Closed on
Jul 10, 1973
Bought by
Orr Mildred N
Purchase Details
Closed on
Jun 7, 1968
Create a Home Valuation Report for This Property
The Home Valuation Report is an in-depth analysis detailing your home's value as well as a comparison with similar homes in the area
Home Values in the Area
Average Home Value in this Area
Purchase History
| Date | Buyer | Sale Price | Title Company |
|---|---|---|---|
| Flores Daniel Rios | $162,500 | -- | |
| Orr Donna | -- | -- | |
| Orr David | $30,000 | -- | |
| Orr Mildred N | -- | -- | |
| -- | -- | -- |
Source: Public Records
Mortgage History
| Date | Status | Borrower | Loan Amount |
|---|---|---|---|
| Open | Flores Daniel Rios | $159,556 |
Source: Public Records
Tax History Compared to Growth
Tax History
| Year | Tax Paid | Tax Assessment Tax Assessment Total Assessment is a certain percentage of the fair market value that is determined by local assessors to be the total taxable value of land and additions on the property. | Land | Improvement |
|---|---|---|---|---|
| 2025 | $1,400 | $60,225 | $0 | $0 |
| 2024 | $1,400 | $60,225 | $8,450 | $51,775 |
| 2023 | $1,400 | $60,225 | $8,450 | $51,775 |
| 2022 | $1,400 | $60,225 | $8,450 | $51,775 |
| 2021 | $1,184 | $60,225 | $8,450 | $51,775 |
| 2020 | $1,021 | $60,225 | $8,450 | $51,775 |
| 2019 | $1,021 | $38,375 | $5,425 | $32,950 |
| 2018 | $982 | $38,375 | $5,425 | $32,950 |
| 2017 | $982 | $38,375 | $5,425 | $32,950 |
| 2014 | $871 | $38,353 | $0 | $0 |
Source: Public Records
Map
Nearby Homes