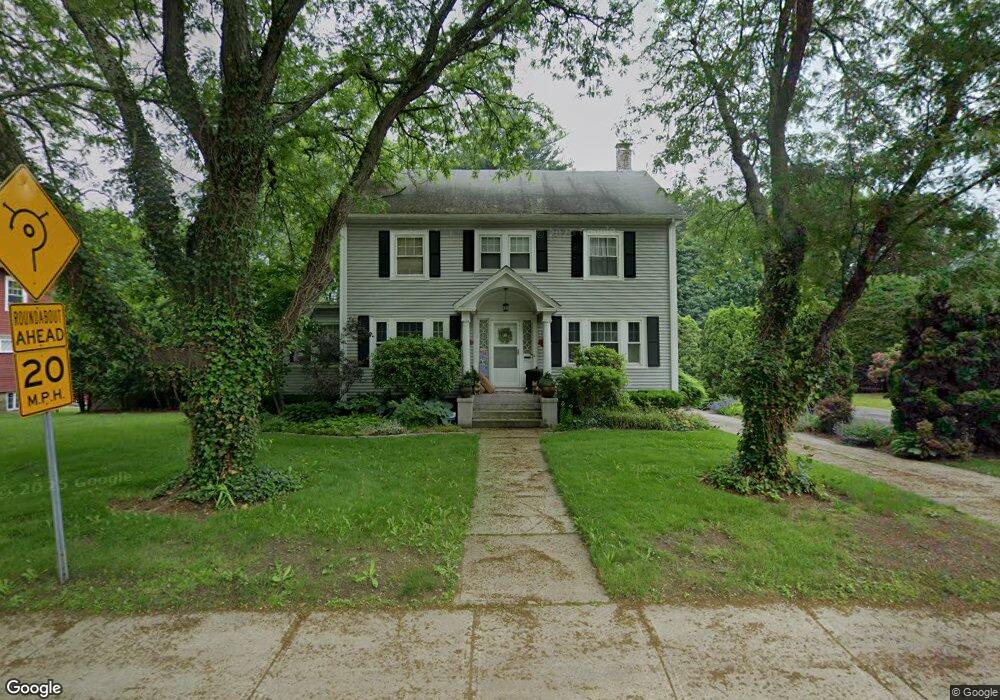
407 S Main St Nashua, NH 03060
South End Nashua NeighborhoodEstimated Value: $552,000 - $589,000
4
Beds
2
Baths
2,026
Sq Ft
$284/Sq Ft
Est. Value
About This Home
This home is located at 407 S Main St, Nashua, NH 03060 and is currently estimated at $575,324, approximately $283 per square foot. 407 S Main St is a home located in Hillsborough County with nearby schools including Sunset Heights Elementary School, Elm Street Middle School, and Nashua High School North.
Ownership History
Date
Name
Owned For
Owner Type
Purchase Details
Closed on
Jun 23, 2016
Sold by
Houlihan 3Rd Joseph F
Bought by
Mcgrath Susan M
Current Estimated Value
Home Financials for this Owner
Home Financials are based on the most recent Mortgage that was taken out on this home.
Original Mortgage
$234,065
Outstanding Balance
$186,290
Interest Rate
3.57%
Mortgage Type
FHA
Estimated Equity
$389,034
Purchase Details
Closed on
Sep 1, 2009
Sold by
Carbone Thomas H and Carbone Rita M
Bought by
Houlihan Joseph F
Home Financials for this Owner
Home Financials are based on the most recent Mortgage that was taken out on this home.
Original Mortgage
$235,856
Interest Rate
5.17%
Mortgage Type
Purchase Money Mortgage
Create a Home Valuation Report for This Property
The Home Valuation Report is an in-depth analysis detailing your home's value as well as a comparison with similar homes in the area
Home Values in the Area
Average Home Value in this Area
Purchase History
| Date | Buyer | Sale Price | Title Company |
|---|---|---|---|
| Mcgrath Susan M | $255,600 | -- | |
| Houlihan Joseph F | $244,000 | -- |
Source: Public Records
Mortgage History
| Date | Status | Borrower | Loan Amount |
|---|---|---|---|
| Open | Mcgrath Susan M | $234,065 | |
| Previous Owner | Houlihan Joseph F | $220,000 | |
| Previous Owner | Houlihan Joseph F | $221,796 | |
| Previous Owner | Houlihan Joseph F | $235,856 | |
| Previous Owner | Houlihan Joseph F | $12,000 |
Source: Public Records
Tax History Compared to Growth
Tax History
| Year | Tax Paid | Tax Assessment Tax Assessment Total Assessment is a certain percentage of the fair market value that is determined by local assessors to be the total taxable value of land and additions on the property. | Land | Improvement |
|---|---|---|---|---|
| 2024 | $8,693 | $546,700 | $170,800 | $375,900 |
| 2023 | $8,196 | $449,600 | $136,600 | $313,000 |
| 2022 | $8,124 | $449,600 | $136,600 | $313,000 |
| 2021 | $7,219 | $310,900 | $91,100 | $219,800 |
| 2020 | $7,029 | $310,900 | $91,100 | $219,800 |
| 2019 | $6,765 | $310,900 | $91,100 | $219,800 |
| 2018 | $6,594 | $310,900 | $91,100 | $219,800 |
| 2017 | $5,983 | $232,000 | $91,200 | $140,800 |
| 2016 | $5,816 | $232,000 | $91,200 | $140,800 |
| 2015 | $5,637 | $229,800 | $91,200 | $138,600 |
| 2014 | $5,527 | $229,800 | $91,200 | $138,600 |
Source: Public Records
Map
Nearby Homes
- 36 Eastman St Unit 26
- 6 Hayden St
- 15 Learned St Unit 123
- 17 Herrick St
- 27 Fifield St Unit 13
- 1 Circle Ave
- 61 Spindlewick Dr
- 63 Dexter St
- 15 Lovell St Unit 3
- 15 Lovell St Unit 7
- 15 Lovell St Unit 10
- 9 Byron Dr
- 97 Linwood St
- 54 Linton St
- 2 Lyons St
- 24 E Otterson St
- 65 Allds St
- 8 Buck St Unit 10
- 22 Wilder St
- 5 Mulberry St
- 405 S Main St
- 409 S Main St Unit 201
- 24 Eastman St Unit 21
- 22 Eastman St
- 28 Eastman St
- 399 S Main St
- 408 S Main St
- 411 S Main St
- 3 Holt Ave
- 404 S Main St
- 4 Learned St
- 397 S Main St
- 23 Eastman St
- 1 Holt Ave
- 25 Eastman St Unit 64
- 15 Eastman St Unit 7475
- 31 Eastman St
- 402 S Main St
- 27 Eastman St Unit 6062
- 2 Holt Ave