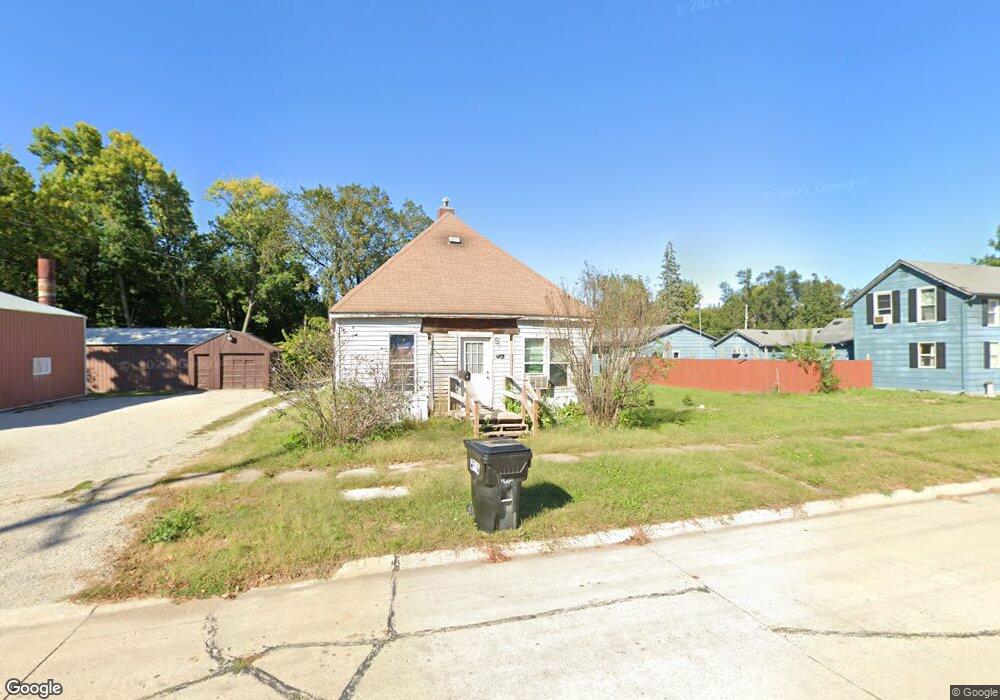
407 W 2nd St Vinton, IA 52349
Estimated Value: $65,581 - $76,000
1
Bed
1
Bath
816
Sq Ft
$86/Sq Ft
Est. Value
About This Home
This home is located at 407 W 2nd St, Vinton, IA 52349 and is currently estimated at $70,194, approximately $86 per square foot. 407 W 2nd St is a home located in Benton County with nearby schools including Tilford Elementary School, Shellsburg Elementary School, and Vinton-Shellsburg Middle School.
Ownership History
Date
Name
Owned For
Owner Type
Purchase Details
Closed on
Aug 18, 2023
Sold by
Schminke Brian O and Schminke Denise A
Bought by
Nix Joan
Current Estimated Value
Purchase Details
Closed on
Aug 2, 2006
Sold by
Weisert Russell W and Weisert Loretta J
Bought by
Schminke Brian O and Schminke Denise A
Home Financials for this Owner
Home Financials are based on the most recent Mortgage that was taken out on this home.
Original Mortgage
$16,000
Interest Rate
6.85%
Mortgage Type
Future Advance Clause Open End Mortgage
Create a Home Valuation Report for This Property
The Home Valuation Report is an in-depth analysis detailing your home's value as well as a comparison with similar homes in the area
Home Values in the Area
Average Home Value in this Area
Purchase History
| Date | Buyer | Sale Price | Title Company |
|---|---|---|---|
| Nix Joan | $15,000 | None Listed On Document | |
| Schminke Brian O | $19,000 | None Available |
Source: Public Records
Mortgage History
| Date | Status | Borrower | Loan Amount |
|---|---|---|---|
| Previous Owner | Schminke Brian O | $16,000 |
Source: Public Records
Tax History Compared to Growth
Tax History
| Year | Tax Paid | Tax Assessment Tax Assessment Total Assessment is a certain percentage of the fair market value that is determined by local assessors to be the total taxable value of land and additions on the property. | Land | Improvement |
|---|---|---|---|---|
| 2025 | $482 | $28,000 | $8,100 | $19,900 |
| 2024 | $482 | $25,700 | $7,700 | $18,000 |
| 2023 | -- | $25,700 | $7,700 | $18,000 |
| 2022 | $446 | $20,200 | $6,200 | $14,000 |
| 2021 | $446 | $20,200 | $6,200 | $14,000 |
| 2020 | $334 | $15,400 | $6,600 | $8,800 |
| 2019 | $398 | $15,400 | $6,600 | $8,800 |
| 2018 | $388 | $18,200 | $5,900 | $12,300 |
| 2017 | $372 | $18,200 | $5,900 | $12,300 |
| 2016 | $366 | $17,000 | $5,500 | $11,500 |
| 2015 | $366 | $17,000 | $5,500 | $11,500 |
| 2014 | $372 | $17,200 | $0 | $0 |
Source: Public Records
Map
Nearby Homes