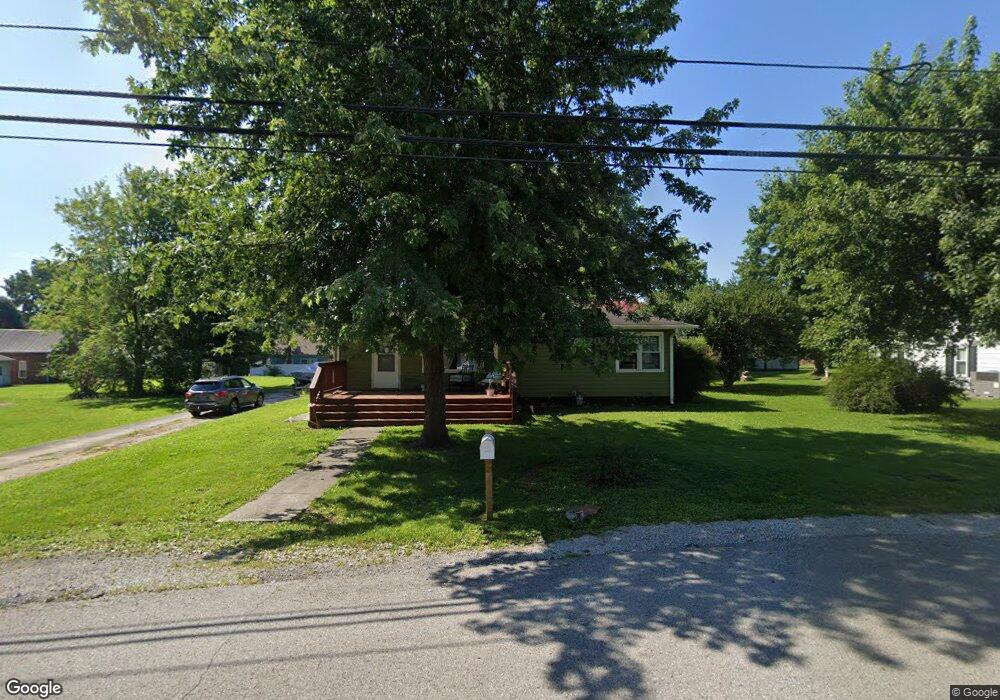
407 W 4th St Livingston, TN 38570
Estimated Value: $185,728 - $219,000
3
Beds
2
Baths
1,448
Sq Ft
$142/Sq Ft
Est. Value
About This Home
This home is located at 407 W 4th St, Livingston, TN 38570 and is currently estimated at $205,182, approximately $141 per square foot. 407 W 4th St is a home located in Overton County.
Ownership History
Date
Name
Owned For
Owner Type
Purchase Details
Closed on
Dec 17, 2015
Sold by
Carter Zelda Estate
Bought by
Carter Joseph
Current Estimated Value
Home Financials for this Owner
Home Financials are based on the most recent Mortgage that was taken out on this home.
Original Mortgage
$40,000
Outstanding Balance
$1,206
Interest Rate
3.98%
Mortgage Type
New Conventional
Estimated Equity
$203,976
Purchase Details
Closed on
Dec 4, 2009
Sold by
Buck Harold Ray
Bought by
Hogue Zelda G
Home Financials for this Owner
Home Financials are based on the most recent Mortgage that was taken out on this home.
Original Mortgage
$67,000
Interest Rate
5.01%
Mortgage Type
Cash
Purchase Details
Closed on
Mar 30, 1987
Bought by
Buck Glodia
Purchase Details
Closed on
Jun 2, 1983
Create a Home Valuation Report for This Property
The Home Valuation Report is an in-depth analysis detailing your home's value as well as a comparison with similar homes in the area
Home Values in the Area
Average Home Value in this Area
Purchase History
| Date | Buyer | Sale Price | Title Company |
|---|---|---|---|
| Carter Joseph | $50,000 | -- | |
| Hogue Zelda G | $75,000 | -- | |
| Buck Glodia | -- | -- | |
| -- | -- | -- |
Source: Public Records
Mortgage History
| Date | Status | Borrower | Loan Amount |
|---|---|---|---|
| Open | Carter Joseph | $40,000 | |
| Previous Owner | Not Available | $67,000 |
Source: Public Records
Tax History Compared to Growth
Tax History
| Year | Tax Paid | Tax Assessment Tax Assessment Total Assessment is a certain percentage of the fair market value that is determined by local assessors to be the total taxable value of land and additions on the property. | Land | Improvement |
|---|---|---|---|---|
| 2024 | $918 | $22,625 | $2,500 | $20,125 |
| 2023 | $818 | $22,625 | $2,500 | $20,125 |
| 2022 | $794 | $22,175 | $2,500 | $19,675 |
| 2021 | $783 | $22,175 | $2,500 | $19,675 |
| 2020 | $772 | $22,175 | $2,500 | $19,675 |
| 2019 | $525 | $14,175 | $2,500 | $11,675 |
| 2018 | $529 | $14,175 | $2,500 | $11,675 |
| 2017 | $529 | $14,300 | $2,500 | $11,800 |
| 2016 | $529 | $14,300 | $2,500 | $11,800 |
| 2015 | $465 | $14,300 | $2,500 | $11,800 |
| 2014 | -- | $14,300 | $2,500 | $11,800 |
| 2013 | -- | $14,500 | $0 | $0 |
Source: Public Records
Map
Nearby Homes