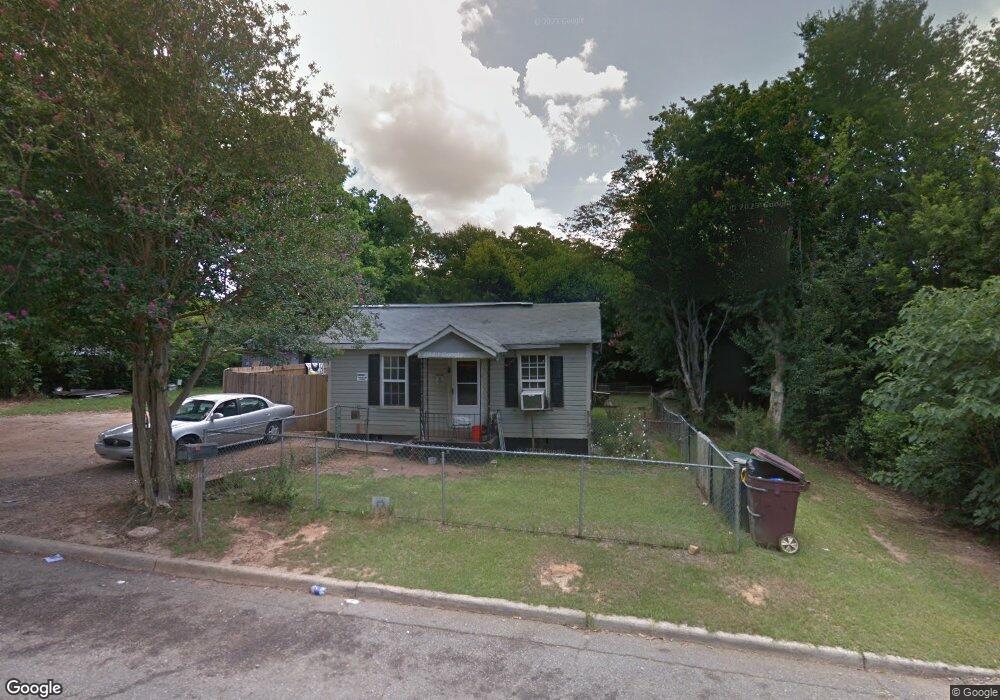
4070 San Juan Ave Macon, GA 31206
Estimated Value: $41,000 - $51,203
2
Beds
1
Bath
904
Sq Ft
$51/Sq Ft
Est. Value
About This Home
This home is located at 4070 San Juan Ave, Macon, GA 31206 and is currently estimated at $46,301, approximately $51 per square foot. 4070 San Juan Ave is a home located in Bibb County with nearby schools including Bruce Elementary School, Rutland Middle School, and Rutland High School.
Ownership History
Date
Name
Owned For
Owner Type
Purchase Details
Closed on
Mar 13, 2025
Sold by
Zepeda Daymbler
Bought by
Alv Roofing Construction Llc
Current Estimated Value
Home Financials for this Owner
Home Financials are based on the most recent Mortgage that was taken out on this home.
Original Mortgage
$29,000
Outstanding Balance
$20,953
Interest Rate
6.95%
Mortgage Type
Seller Take Back
Estimated Equity
$25,348
Purchase Details
Closed on
Jan 7, 2021
Sold by
Barfield Carolyn P
Bought by
Zepeda Daymbler
Create a Home Valuation Report for This Property
The Home Valuation Report is an in-depth analysis detailing your home's value as well as a comparison with similar homes in the area
Home Values in the Area
Average Home Value in this Area
Purchase History
| Date | Buyer | Sale Price | Title Company |
|---|---|---|---|
| Alv Roofing Construction Llc | $39,000 | None Listed On Document | |
| Zepeda Daymbler | $8,500 | None Available |
Source: Public Records
Mortgage History
| Date | Status | Borrower | Loan Amount |
|---|---|---|---|
| Open | Alv Roofing Construction Llc | $29,000 |
Source: Public Records
Tax History Compared to Growth
Tax History
| Year | Tax Paid | Tax Assessment Tax Assessment Total Assessment is a certain percentage of the fair market value that is determined by local assessors to be the total taxable value of land and additions on the property. | Land | Improvement |
|---|---|---|---|---|
| 2025 | $295 | $12,008 | $2,300 | $9,708 |
| 2024 | $293 | $11,556 | $2,300 | $9,256 |
| 2023 | $293 | $11,556 | $2,300 | $9,256 |
| 2022 | $118 | $8,238 | $1,667 | $6,571 |
| 2021 | $200 | $5,270 | $1,500 | $3,770 |
| 2020 | $140 | $3,607 | $1,500 | $2,107 |
| 2019 | $141 | $3,607 | $1,500 | $2,107 |
| 2018 | $538 | $2,973 | $1,167 | $1,806 |
| 2017 | $111 | $2,973 | $1,167 | $1,806 |
| 2016 | $103 | $2,973 | $1,167 | $1,806 |
| 2015 | $160 | $3,274 | $1,167 | $2,107 |
| 2014 | $81 | $4,300 | $1,334 | $2,966 |
Source: Public Records
Map
Nearby Homes