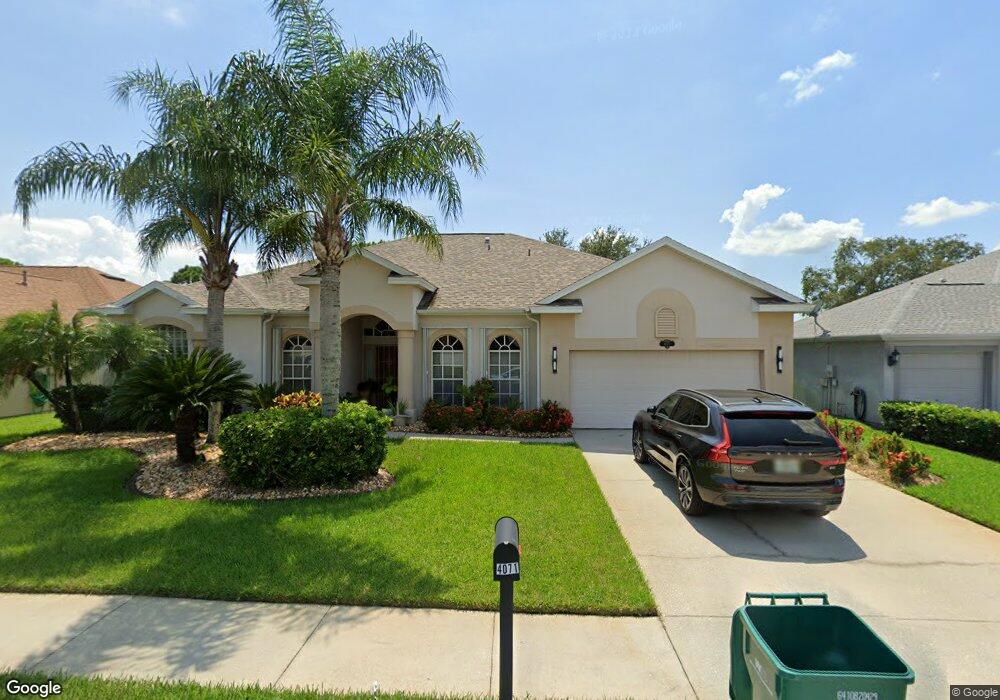
4071 Estancia Way Melbourne, FL 32934
Estimated Value: $580,598 - $636,000
4
Beds
3
Baths
2,551
Sq Ft
$238/Sq Ft
Est. Value
About This Home
This home is located at 4071 Estancia Way, Melbourne, FL 32934 and is currently estimated at $606,150, approximately $237 per square foot. 4071 Estancia Way is a home located in Brevard County with nearby schools including Longleaf Elementary School, Lyndon B. Johnson Middle School, and Eau Gallie High School.
Ownership History
Date
Name
Owned For
Owner Type
Purchase Details
Closed on
Dec 10, 2003
Sold by
Eye Thomas A and Eye Margaret A
Bought by
Surovy John P and Surovy Gwendolyne Romeo
Current Estimated Value
Home Financials for this Owner
Home Financials are based on the most recent Mortgage that was taken out on this home.
Original Mortgage
$296,000
Outstanding Balance
$138,118
Interest Rate
5.98%
Estimated Equity
$468,032
Purchase Details
Closed on
Jun 8, 2000
Sold by
Lennar Homes Inc
Bought by
Eye Thomas A and Eye Margaret A
Home Financials for this Owner
Home Financials are based on the most recent Mortgage that was taken out on this home.
Original Mortgage
$209,900
Interest Rate
8.27%
Purchase Details
Closed on
May 31, 2000
Sold by
Lennar Homes Inc
Bought by
Boyce John C and Boyce Barbara C
Home Financials for this Owner
Home Financials are based on the most recent Mortgage that was taken out on this home.
Original Mortgage
$209,900
Interest Rate
8.27%
Create a Home Valuation Report for This Property
The Home Valuation Report is an in-depth analysis detailing your home's value as well as a comparison with similar homes in the area
Home Values in the Area
Average Home Value in this Area
Purchase History
| Date | Buyer | Sale Price | Title Company |
|---|---|---|---|
| Surovy John P | $296,000 | State Title Partners Llp | |
| Eye Thomas A | -- | -- | |
| Eye Thomas A | $221,000 | -- | |
| Boyce John C | $166,000 | -- |
Source: Public Records
Mortgage History
| Date | Status | Borrower | Loan Amount |
|---|---|---|---|
| Open | Surovy John P | $296,000 | |
| Previous Owner | Eye Thomas A | $209,900 |
Source: Public Records
Tax History Compared to Growth
Tax History
| Year | Tax Paid | Tax Assessment Tax Assessment Total Assessment is a certain percentage of the fair market value that is determined by local assessors to be the total taxable value of land and additions on the property. | Land | Improvement |
|---|---|---|---|---|
| 2025 | $3,345 | $240,040 | -- | -- |
| 2024 | $3,264 | $233,280 | -- | -- |
| 2023 | $3,264 | $226,490 | $0 | $0 |
| 2022 | $3,064 | $219,900 | $0 | $0 |
| 2021 | $3,103 | $213,500 | $0 | $0 |
| 2020 | $3,068 | $210,560 | $0 | $0 |
| 2019 | $3,092 | $205,830 | $0 | $0 |
| 2018 | $3,083 | $202,000 | $0 | $0 |
| 2017 | $3,087 | $197,850 | $0 | $0 |
| 2016 | $3,172 | $193,790 | $50,000 | $143,790 |
| 2015 | $3,234 | $192,450 | $45,000 | $147,450 |
| 2014 | $3,293 | $190,930 | $35,000 | $155,930 |
Source: Public Records
Map
Nearby Homes
- 4040 Estancia Way
- 4014 Estancia Way
- 4013 Estancia Way
- 3651 Big Pine Rd
- 3530 Big Pine Rd
- 2928 Crossbow Way
- 3440 Holly Springs Rd
- 3964 Saint Armens Cir
- 3837 Saint Armens Cir
- 3635 Manassas Ave
- 3240 Arden Cir
- 3845 Saint Armens Cir
- 3844 Saint Armens Cir
- 3257 Arden Cir
- 3869 Saint Armens Cir
- 3271 Arden Cir
- 3177 Arden Cir
- 3760 Elizabeth Springs Way
- 2756 Locksley Rd
- 3904 Saint Armens Cir
- 4069 Estancia Way
- 4067 Estancia Way
- 4075 Estancia Way
- 4038 Estancia Way
- 4068 Estancia Way
- 4077 Estancia Way
- 4065 Estancia Way
- 4042 Estancia Way
- 4062 Estancia Way
- 4034 Estancia Way
- 4063 Estancia Way
- 4044 Estancia Way
- 4039 Estancia Way
- 4060 Estancia Way
- 4061 Estancia Way
- 4041 Estancia Way
- 4037 Estancia Way
- 4032 Estancia Way
- 4043 Estancia Way
- 4035 Estancia Way