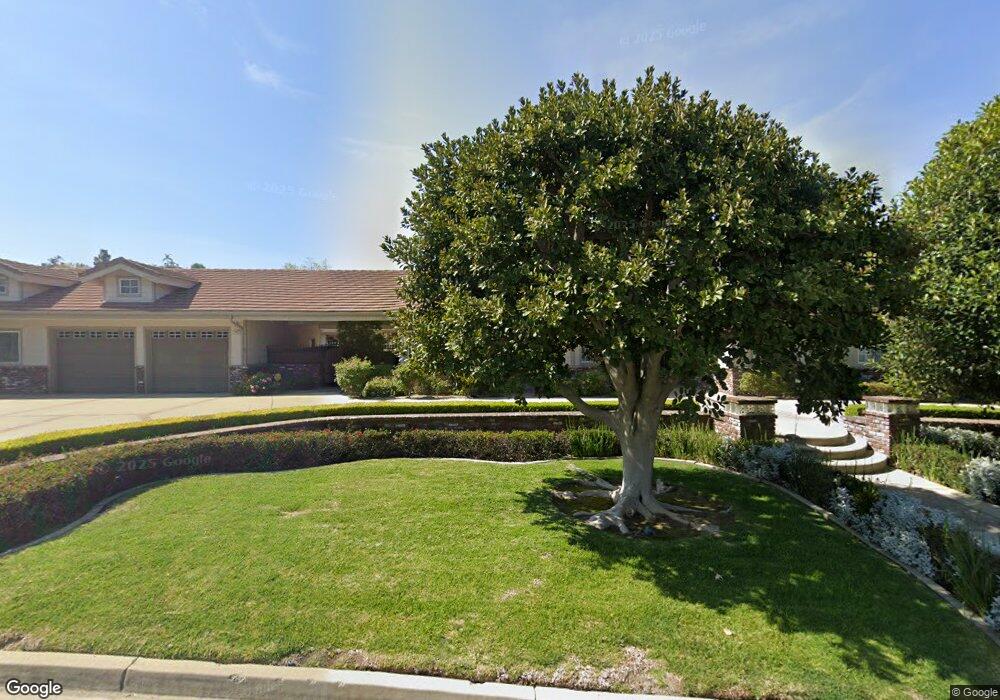
4071 Live Oak Ln Yorba Linda, CA 92886
Estimated Value: $4,584,000 - $4,826,000
7
Beds
9
Baths
9,387
Sq Ft
$500/Sq Ft
Est. Value
About This Home
This home is located at 4071 Live Oak Ln, Yorba Linda, CA 92886 and is currently estimated at $4,694,283, approximately $500 per square foot. 4071 Live Oak Ln is a home located in Orange County with nearby schools including Fairmont Elementary, Bernardo Yorba Middle School, and Yorba Linda High School.
Ownership History
Date
Name
Owned For
Owner Type
Purchase Details
Closed on
Mar 1, 2020
Sold by
Wu Eric Chengyuan and Wu Frances Lin
Bought by
Wu Eric Chengyuan and Wu Frances Lin
Current Estimated Value
Purchase Details
Closed on
Sep 11, 2012
Sold by
Wu Eric Chengyuan and Wu Frances Lin
Bought by
Wu Eric Chengyuan and Wu Frances Lin
Purchase Details
Closed on
May 24, 2012
Sold by
Collins Winnifred
Bought by
Collins Winnifred and Campbell Marcia
Purchase Details
Closed on
Nov 29, 2010
Sold by
Collins Winnifred
Bought by
Wu Eric Chengyuan and Lin Chun Yao
Home Financials for this Owner
Home Financials are based on the most recent Mortgage that was taken out on this home.
Original Mortgage
$700,000
Outstanding Balance
$435,941
Interest Rate
3.12%
Mortgage Type
New Conventional
Estimated Equity
$4,258,342
Purchase Details
Closed on
Jul 4, 2001
Sold by
Collins James Randall and Collins Winnifred
Bought by
Collins James Randall and Collins Winnifred
Purchase Details
Closed on
Jan 24, 2001
Sold by
Collins Randall and Collins Winnifred L
Bought by
Collins Randall and Collins Winnifred L
Create a Home Valuation Report for This Property
The Home Valuation Report is an in-depth analysis detailing your home's value as well as a comparison with similar homes in the area
Home Values in the Area
Average Home Value in this Area
Purchase History
| Date | Buyer | Sale Price | Title Company |
|---|---|---|---|
| Wu Eric Chengyuan | -- | Accommodation | |
| Wu Eric Chengyuan | -- | None Available | |
| Collins Winnifred | -- | None Available | |
| Wu Eric Chengyuan | $2,000,000 | Fidelity National Title Co | |
| Collins James Randall | -- | -- | |
| Collins Randall | -- | -- |
Source: Public Records
Mortgage History
| Date | Status | Borrower | Loan Amount |
|---|---|---|---|
| Open | Wu Eric Chengyuan | $700,000 |
Source: Public Records
Tax History Compared to Growth
Tax History
| Year | Tax Paid | Tax Assessment Tax Assessment Total Assessment is a certain percentage of the fair market value that is determined by local assessors to be the total taxable value of land and additions on the property. | Land | Improvement |
|---|---|---|---|---|
| 2025 | $28,124 | $2,605,459 | $63,172 | $2,542,287 |
| 2024 | $28,124 | $2,554,372 | $61,933 | $2,492,439 |
| 2023 | $27,665 | $2,504,287 | $60,719 | $2,443,568 |
| 2022 | $27,443 | $2,455,184 | $59,529 | $2,395,655 |
| 2021 | $26,966 | $2,407,044 | $58,362 | $2,348,682 |
| 2020 | $26,924 | $2,382,363 | $57,763 | $2,324,600 |
| 2019 | $25,800 | $2,335,650 | $56,630 | $2,279,020 |
| 2018 | $25,624 | $2,289,853 | $55,519 | $2,234,334 |
| 2017 | $25,204 | $2,244,954 | $54,430 | $2,190,524 |
| 2016 | $24,674 | $2,200,936 | $53,363 | $2,147,573 |
| 2015 | $24,399 | $2,167,876 | $52,561 | $2,115,315 |
| 2014 | $23,230 | $2,084,426 | $50,520 | $2,033,906 |
Source: Public Records
Map
Nearby Homes
- 3862 Ravenswood Dr
- 4152 Beech Ave
- 3635 Banyon Rim Rd
- 21290 Clear Haven Dr
- 4090 Naples Ct
- 3610 Windsong Cir
- 21590 Via Pepita
- 3971 Hollow Ridge Ct
- 20681 Via Amarilla
- 3695 Blue Gum Dr
- 4418 Avenida Del Este
- 4362 Via Alegre
- 21451 Cloud Ridge
- 20100 Livorno Ln
- 20000 Villa Torino
- 4066 Villa Quintana
- 20660 Calle Feliz
- 4545 Avenida Rio Del Oro
- Cielo Vista 3 Plan at Cielo Vista
- Cielo Vista Plan at Cielo Vista
- 4069 Live Oak Ln
- 4075 Live Oak Ln
- 4070 Live Oak Ln
- 4061 Pepper Ave
- 4068 Beech Ave
- 20760 Chateau Ave
- 20780 Chateau Ave
- 20740 Chateau Ave
- 4070 Beech Ave
- 20800 Chateau Ave
- 4065 Live Oak Ln
- 4080 Live Oak Ln
- 20720 Chateau Ave
- 20820 Chateau Ave
- 20264 Mirkwood Run
- 4066 Live Oak Ln
- 4068 Rainwood Ave
- 4074 Beech Ave
- 4065 Pepper Ave
- 4085 Live Oak Ln