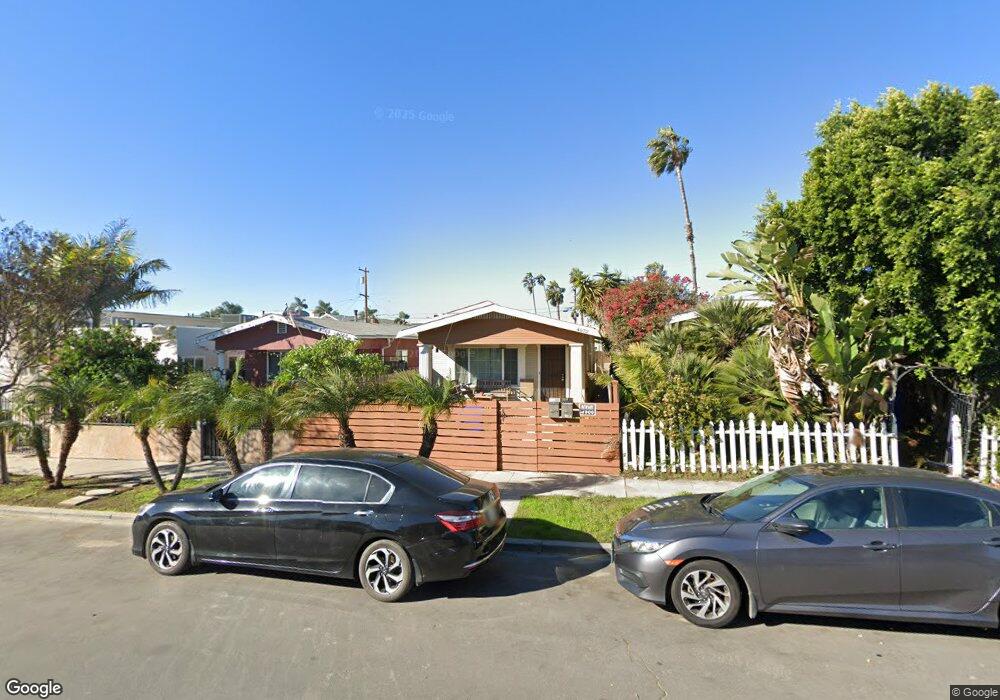
4072 38th St San Diego, CA 92105
Corridor NeighborhoodEstimated Value: $625,000 - $722,789
3
Beds
2
Baths
--
Sq Ft
3,485
Sq Ft Lot
About This Home
This home is located at 4072 38th St, San Diego, CA 92105 and is currently estimated at $665,447. 4072 38th St is a home located in San Diego County with nearby schools including Edison Elementary School, Wilson Middle School, and Herbert Hoover High School.
Ownership History
Date
Name
Owned For
Owner Type
Purchase Details
Closed on
Feb 10, 2015
Sold by
Steward Thomas L
Bought by
Irish Genevieve E
Current Estimated Value
Home Financials for this Owner
Home Financials are based on the most recent Mortgage that was taken out on this home.
Original Mortgage
$274,419
Interest Rate
3.8%
Mortgage Type
FHA
Purchase Details
Closed on
Jan 23, 2015
Sold by
Covarrubias Cynthia A
Bought by
Irish Genevieve E
Home Financials for this Owner
Home Financials are based on the most recent Mortgage that was taken out on this home.
Original Mortgage
$274,419
Interest Rate
3.8%
Mortgage Type
FHA
Purchase Details
Closed on
Dec 12, 2005
Sold by
Covarrubias Robert J and Covarrubias Cynthia A
Bought by
Covarrubias Robert J and Covarrubias Cynthia A
Purchase Details
Closed on
Apr 5, 2005
Sold by
Perez Guillermo J
Bought by
Covarrubias Robert J and Covarrubias Cynthia A
Purchase Details
Closed on
Aug 19, 2003
Sold by
Covarrubias Robert J
Bought by
Covarrubias Robert J and Covarrubias Cynthia A
Create a Home Valuation Report for This Property
The Home Valuation Report is an in-depth analysis detailing your home's value as well as a comparison with similar homes in the area
Home Values in the Area
Average Home Value in this Area
Purchase History
| Date | Buyer | Sale Price | Title Company |
|---|---|---|---|
| Irish Genevieve E | -- | Fidelity National Title Co | |
| Irish Genevieve E | $290,000 | Fidelity National Title | |
| Covarrubias Robert J | -- | -- | |
| Covarrubias Robert J | -- | Fidelity National Title San | |
| Covarrubias Robert J | $140,000 | -- | |
| Covarrubias Robert J | -- | -- |
Source: Public Records
Mortgage History
| Date | Status | Borrower | Loan Amount |
|---|---|---|---|
| Previous Owner | Irish Genevieve E | $274,419 |
Source: Public Records
Tax History Compared to Growth
Tax History
| Year | Tax Paid | Tax Assessment Tax Assessment Total Assessment is a certain percentage of the fair market value that is determined by local assessors to be the total taxable value of land and additions on the property. | Land | Improvement |
|---|---|---|---|---|
| 2025 | $4,231 | $348,524 | $287,326 | $61,198 |
| 2024 | $4,231 | $341,692 | $281,693 | $59,999 |
| 2023 | $4,138 | $334,993 | $276,170 | $58,823 |
| 2022 | $4,028 | $328,425 | $270,755 | $57,670 |
| 2021 | $4,000 | $321,987 | $265,447 | $56,540 |
| 2020 | $3,952 | $318,687 | $262,726 | $55,961 |
| 2019 | $3,882 | $312,439 | $257,575 | $54,864 |
| 2018 | $3,630 | $306,314 | $252,525 | $53,789 |
| 2017 | $3,544 | $300,309 | $247,574 | $52,735 |
| 2016 | $3,487 | $294,421 | $242,720 | $51,701 |
| 2015 | $2,594 | $218,303 | $179,968 | $38,335 |
| 2014 | $2,554 | $214,028 | $176,443 | $37,585 |
Source: Public Records
Map
Nearby Homes
- 4041 38th St
- 4164 38th St
- 3737 Orange Ave
- 4102 Cherokee Ave
- 3846 38th St Unit 5
- 3846 38th St Unit 3
- 4164 Cherokee Ave Unit G
- 4164 Cherokee Ave Unit D
- 4233 39th St Unit C
- 4243 39th St Unit A
- 4053 Wilson Ave
- 4153 Wilson Ave
- 3812-14 36th St
- 4220 41st St Unit 4
- 3728 Cherokee Ave
- 4342 39th St
- 3783 Wilson Ave Unit A
- 4119 Orange Ave
- 4174 Marlborough Ave Unit 8
- 4239 35th St
- 4076 38th St
- 4078/4080 N 38th St
- 4078 38th St Unit 80
- 4066 38th St Unit 68
- 4086 38th St
- 4082 38th St
- 4058 38th St
- 4058 38th St Unit 64
- 4082 38th St
- 4082-86 38th St
- 4084 38th St
- 4050 38th St
- 3739 Polk Ave
- 3727 Polk Ave Unit 29
- 4094 38th St
- 4067 37th St
- 4075 37th St
- 4042-48 38th St
- 4042 38th St
- 4079 37th St