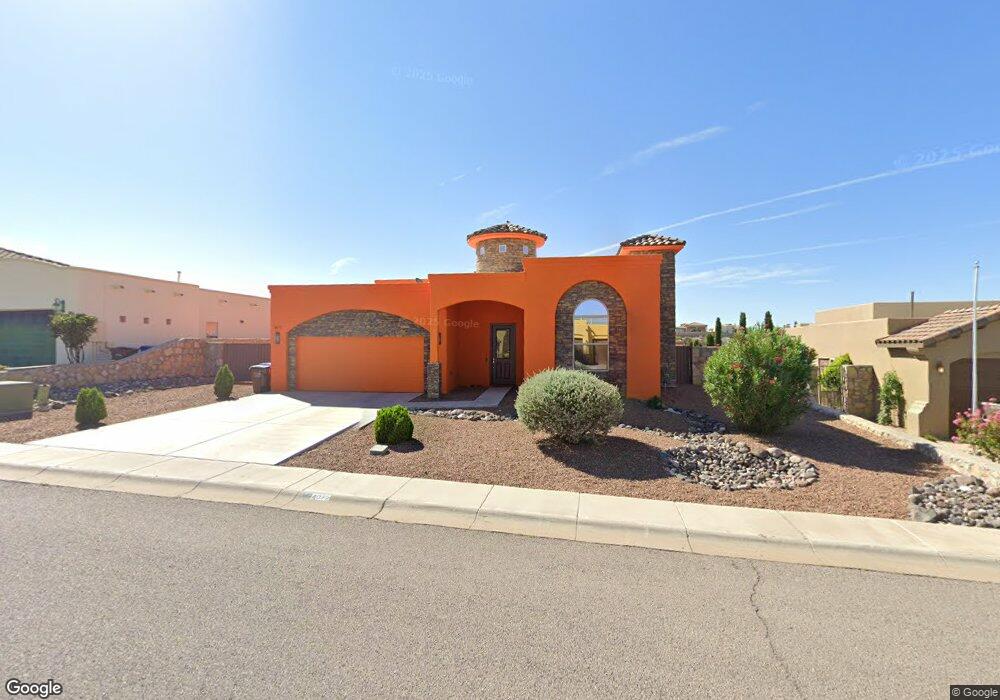
4072 Demos Ave Las Cruces, NM 88011
Estimated Value: $428,149 - $448,000
3
Beds
3
Baths
2,285
Sq Ft
$192/Sq Ft
Est. Value
About This Home
This home is located at 4072 Demos Ave, Las Cruces, NM 88011 and is currently estimated at $438,075, approximately $191 per square foot. 4072 Demos Ave is a home with nearby schools including Desert Hills Elementary School, Camino Real Middle School, and Centennial High School.
Ownership History
Date
Name
Owned For
Owner Type
Purchase Details
Closed on
Jun 9, 2021
Sold by
Lara Brian N
Bought by
Lara Nancy A and Obiero Nancy A
Current Estimated Value
Purchase Details
Closed on
Aug 9, 2013
Sold by
Spirit View Homes Inc
Bought by
Lara Brian N and Obiero Nancy A
Home Financials for this Owner
Home Financials are based on the most recent Mortgage that was taken out on this home.
Original Mortgage
$247,326
Interest Rate
4.49%
Mortgage Type
New Conventional
Purchase Details
Closed on
Mar 8, 2013
Sold by
Cruces Equity Parnters Lp
Bought by
Spirit View Homes Inc
Home Financials for this Owner
Home Financials are based on the most recent Mortgage that was taken out on this home.
Original Mortgage
$202,400
Interest Rate
3.44%
Mortgage Type
Construction
Create a Home Valuation Report for This Property
The Home Valuation Report is an in-depth analysis detailing your home's value as well as a comparison with similar homes in the area
Home Values in the Area
Average Home Value in this Area
Purchase History
| Date | Buyer | Sale Price | Title Company |
|---|---|---|---|
| Lara Nancy A | -- | None Listed On Document | |
| Lara Brian N | -- | Southwestern Abstract & Tit | |
| Spirit View Homes Inc | -- | Southwestern Abstract & Ti |
Source: Public Records
Mortgage History
| Date | Status | Borrower | Loan Amount |
|---|---|---|---|
| Previous Owner | Lara Brian N | $247,326 | |
| Previous Owner | Spirit View Homes Inc | $202,400 |
Source: Public Records
Tax History Compared to Growth
Tax History
| Year | Tax Paid | Tax Assessment Tax Assessment Total Assessment is a certain percentage of the fair market value that is determined by local assessors to be the total taxable value of land and additions on the property. | Land | Improvement |
|---|---|---|---|---|
| 2024 | $3,350 | $109,991 | $16,667 | $93,324 |
| 2023 | $3,303 | $106,788 | $16,667 | $90,121 |
| 2022 | $3,252 | $103,678 | $16,667 | $87,011 |
| 2021 | $3,146 | $100,658 | $16,667 | $83,991 |
| 2020 | $3,071 | $97,726 | $16,667 | $81,059 |
| 2019 | $2,989 | $94,880 | $16,667 | $78,213 |
| 2018 | $2,885 | $92,117 | $16,667 | $75,450 |
| 2017 | $2,648 | $92,117 | $16,667 | $75,450 |
| 2016 | $2,605 | $89,433 | $18,333 | $71,100 |
| 2015 | $2,543 | $260,500 | $53,400 | $207,100 |
| 2014 | $2,542 | $260,500 | $53,400 | $207,100 |
Source: Public Records
Map
Nearby Homes
- 4123 Bella Sierra Ct
- 1009 Calle Griega
- 4051 Bella Sierra Ct
- 4026 La Purisima Dr
- 4135 Calle Belleza
- 1876 El Presidio
- 1900 Santa Ines St
- 1699 Boulders Dr
- 1695 Boulders Dr
- 1888 El Presidio
- 4170 Campana Ct
- 1687 Boulders Dr
- 1721 Stone Mountain Ln
- 4309 Capistrano Ave
- 1932 Santa Ines St
- 4133 Capistrano Ave
- 507 Corona Del Campo Loop
- 536 La Melodia Dr
- 4163 La Purisima Dr
- 506 Corona Del Campo Loop
- 4068 Demos Ave
- 4076 Demos Ave
- 4107 Bella Sierra Ct
- 4111 Bella Sierra Ct
- 4115 Bella Sierra Ct
- 4103 Bella Sierra Ct
- 4064 Demos Ave
- 4080 Demos Ave
- 4069 Demos Ave
- 4099 Bella Sierra Ct
- 4119 Bella Sierra Ct
- 4073 Demos Ave
- 4095 Bella Sierra Ct
- 4065 Demos Ave
- 4060 Demos Ave
- 4084 Demos Ave
- 4091 Bella Sierra Ct
- 4079 Demos Ave
- 4127 Bella Sierra Ct
- 4087 Bella Sierra Ct