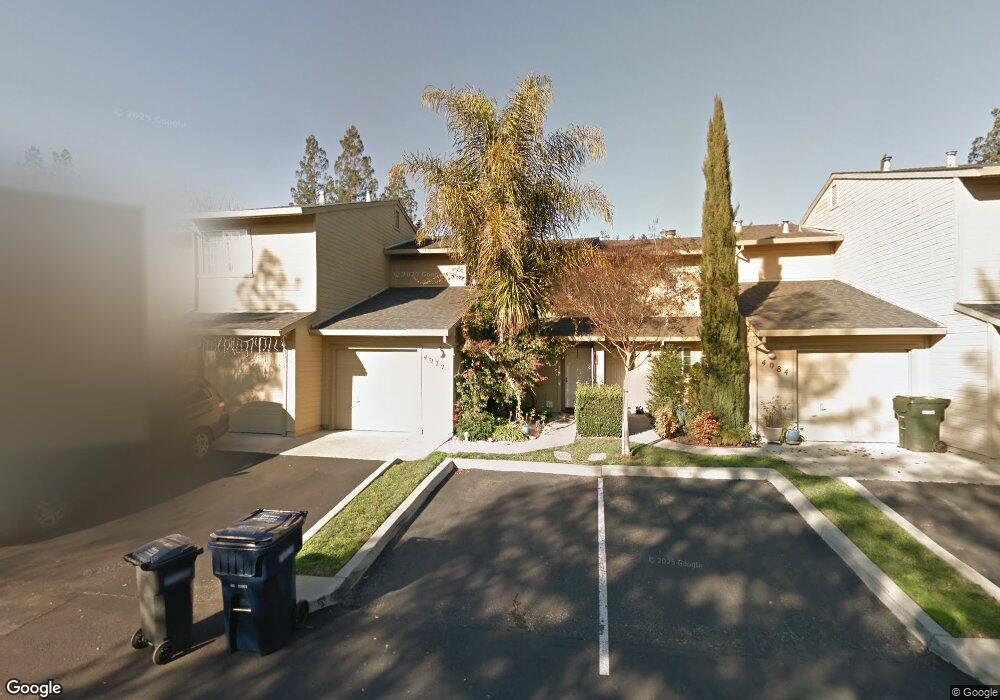
4072 Hillcrest Common Livermore, CA 94550
Jensen NeighborhoodEstimated Value: $540,452 - $660,000
2
Beds
2
Baths
1,021
Sq Ft
$594/Sq Ft
Est. Value
About This Home
This home is located at 4072 Hillcrest Common, Livermore, CA 94550 and is currently estimated at $606,613, approximately $594 per square foot. 4072 Hillcrest Common is a home located in Alameda County with nearby schools including Jackson Avenue Elementary School, East Avenue Middle School, and Livermore High School.
Ownership History
Date
Name
Owned For
Owner Type
Purchase Details
Closed on
Mar 17, 2021
Sold by
Reynolds Susan C and Reynolds Lindsay
Bought by
Susan C Reynolds Living Trust and Reynolds
Current Estimated Value
Home Financials for this Owner
Home Financials are based on the most recent Mortgage that was taken out on this home.
Original Mortgage
$206,000
Outstanding Balance
$183,079
Interest Rate
2.73%
Mortgage Type
New Conventional
Estimated Equity
$423,534
Purchase Details
Closed on
Jul 26, 2018
Sold by
Reynolds Susan C and Susan C Reynolds Living Trust
Bought by
Reynolds Susan C and Susan C Reynolds Living Trust
Purchase Details
Closed on
Feb 10, 2015
Sold by
Reynolds Susan C
Bought by
Reynolds Susan C and Susan C Reynolds Living Trust
Purchase Details
Closed on
Jul 27, 2009
Sold by
Kosovic Branko and Lundquist Julie K
Bought by
Reynolds Susan
Home Financials for this Owner
Home Financials are based on the most recent Mortgage that was taken out on this home.
Original Mortgage
$188,746
Interest Rate
5.31%
Mortgage Type
FHA
Purchase Details
Closed on
Aug 16, 2002
Sold by
Hatch Robert C and Eric G Bedford 2001 Trust
Bought by
Kosovic Branko and Lundquist Julie K
Home Financials for this Owner
Home Financials are based on the most recent Mortgage that was taken out on this home.
Original Mortgage
$244,800
Interest Rate
5.12%
Purchase Details
Closed on
Oct 15, 2001
Sold by
Bedford Eric G
Bought by
Bedford Eric G and The Eric G Bedford 2001 Trust
Purchase Details
Closed on
May 4, 2001
Sold by
Atwell Jory and Nguyen Jory R
Bought by
Bedford Eric G
Home Financials for this Owner
Home Financials are based on the most recent Mortgage that was taken out on this home.
Original Mortgage
$261,200
Interest Rate
6.89%
Purchase Details
Closed on
Mar 19, 1999
Sold by
Nguyen Hung B
Bought by
Attwell Jory and Nguyen Jory R
Home Financials for this Owner
Home Financials are based on the most recent Mortgage that was taken out on this home.
Original Mortgage
$150,000
Interest Rate
6.73%
Purchase Details
Closed on
Sep 30, 1996
Sold by
Glavis Jeanne N
Bought by
Nguyen Hung B and Nguyen Jory R
Home Financials for this Owner
Home Financials are based on the most recent Mortgage that was taken out on this home.
Original Mortgage
$121,350
Interest Rate
7.62%
Create a Home Valuation Report for This Property
The Home Valuation Report is an in-depth analysis detailing your home's value as well as a comparison with similar homes in the area
Home Values in the Area
Average Home Value in this Area
Purchase History
| Date | Buyer | Sale Price | Title Company |
|---|---|---|---|
| Susan C Reynolds Living Trust | -- | Old Republic Title | |
| Reynolds Susan C | -- | Old Republic Title | |
| Reynolds Susan C | -- | Old Republic Title | |
| Reynolds Susan C | -- | Old Republic Title Company | |
| Reynolds Susan C | -- | None Available | |
| Reynolds Susan | $265,000 | Chicago Title Company | |
| Kosovic Branko | $306,000 | Alliance Title Company | |
| Bedford Eric G | -- | -- | |
| Bedford Eric G | $275,000 | Fidelity National Title Co | |
| Attwell Jory | -- | American Title Co | |
| Nguyen Hung B | $135,000 | Old Republic Title Company |
Source: Public Records
Mortgage History
| Date | Status | Borrower | Loan Amount |
|---|---|---|---|
| Open | Reynolds Susan C | $206,000 | |
| Closed | Reynolds Susan C | $206,000 | |
| Previous Owner | Reynolds Susan | $188,746 | |
| Previous Owner | Kosovic Branko | $244,800 | |
| Previous Owner | Bedford Eric G | $261,200 | |
| Previous Owner | Attwell Jory | $150,000 | |
| Previous Owner | Nguyen Hung B | $121,350 | |
| Closed | Kosovic Branko | $45,900 |
Source: Public Records
Tax History
| Year | Tax Paid | Tax Assessment Tax Assessment Total Assessment is a certain percentage of the fair market value that is determined by local assessors to be the total taxable value of land and additions on the property. | Land | Improvement |
|---|---|---|---|---|
| 2025 | $4,797 | $342,043 | $102,613 | $239,430 |
| 2024 | $4,797 | $335,338 | $100,601 | $234,737 |
| 2023 | $4,718 | $328,764 | $98,629 | $230,135 |
| 2022 | $4,642 | $322,318 | $96,695 | $225,623 |
| 2021 | $3,936 | $316,001 | $94,800 | $221,201 |
| 2020 | $4,384 | $312,763 | $93,829 | $218,934 |
| 2019 | $4,374 | $306,631 | $91,989 | $214,642 |
| 2018 | $4,276 | $300,620 | $90,186 | $210,434 |
| 2017 | $4,164 | $294,727 | $88,418 | $206,309 |
| 2016 | $3,927 | $288,950 | $86,685 | $202,265 |
| 2015 | $3,712 | $284,611 | $85,383 | $199,228 |
| 2014 | $3,661 | $279,038 | $83,711 | $195,327 |
Source: Public Records
Map
Nearby Homes
- 4115 Freeda Ct
- 3910 East Ave
- 317 Hillcrest Ave
- 3959 Purdue Way
- 843 Jensen St
- 3797 Oregon Way
- 1368 Pegan Common
- 4669 Almond Cir
- 3628 Carrigan Common
- 337 Chris Common Unit 111
- 4671 Laurie Common Unit 105
- 4671 Laurie Common Unit 103
- 1215 S Livermore Ave
- 3873 Inverness Common
- 4844 Mulqueeney Common
- 112 Martin Ave
- 3370 Gardella Plaza
- 2840 Salt Pond Common
- 5218 Norma Way
- 2463 6th St
- 4084 Hillcrest Common
- 4070 Hillcrest Common
- 4088 Hillcrest Common
- 4056 Hillcrest Common
- 4068 Hillcrest Common
- 4044 Hillcrest Common
- 4030 Hillcrest Common
- 743 Hayes Ave
- 731 Hayes Ave
- 4076 East Ave
- 769 Hayes Ct
- 761 Hayes Ct
- 4028 Hillcrest Common
- 4026 Hillcrest Common
- 777 Hayes Ct
- 4014 Hillcrest Common
- 4012 Hillcrest Common
- 4084 East Ave
- 635 Hayes Ave
- 4086 East Ave
Your Personal Tour Guide
Ask me questions while you tour the home.