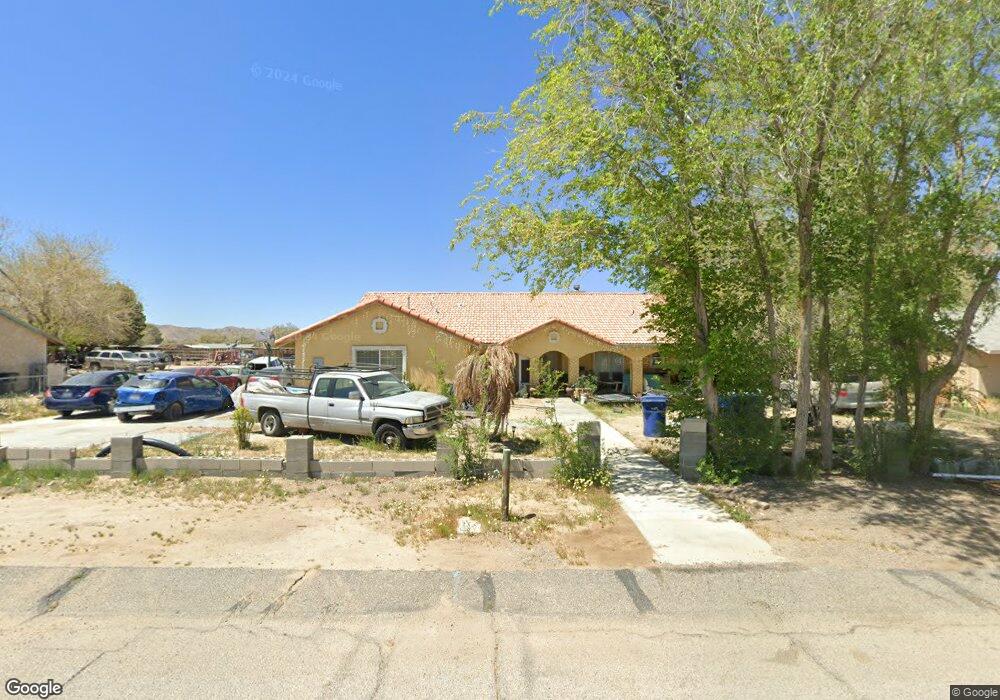
40723 176th St E Lancaster, CA 93535
Estimated Value: $417,000 - $476,000
4
Beds
2
Baths
1,781
Sq Ft
$250/Sq Ft
Est. Value
About This Home
This home is located at 40723 176th St E, Lancaster, CA 93535 and is currently estimated at $444,958, approximately $249 per square foot. 40723 176th St E is a home located in Los Angeles County with nearby schools including Vista San Gabriel Elementary School, Challenger Middle School, and Littlerock High School.
Ownership History
Date
Name
Owned For
Owner Type
Purchase Details
Closed on
Feb 24, 2010
Sold by
Bowen Ray B
Bought by
Bowen Ray B
Current Estimated Value
Home Financials for this Owner
Home Financials are based on the most recent Mortgage that was taken out on this home.
Original Mortgage
$85,000
Outstanding Balance
$56,308
Interest Rate
4.97%
Mortgage Type
New Conventional
Estimated Equity
$388,650
Purchase Details
Closed on
Aug 5, 2009
Sold by
Bowen Cynthia S
Bought by
Bowen Ray B
Purchase Details
Closed on
Jul 28, 2009
Sold by
Federal National Mortgage Association
Bought by
Bowen Ray B
Purchase Details
Closed on
Feb 27, 2009
Sold by
Rodas Silvia M and Rodas Jose
Bought by
Federal National Mortgage Association
Purchase Details
Closed on
Jun 27, 2006
Sold by
Ipsen Jens and The Jens Ipsen Trust
Bought by
Rodas Jose
Purchase Details
Closed on
May 24, 2004
Sold by
Amancio Corazon V
Bought by
Ipsen Jens and The Jens Ipsen Trust
Create a Home Valuation Report for This Property
The Home Valuation Report is an in-depth analysis detailing your home's value as well as a comparison with similar homes in the area
Home Values in the Area
Average Home Value in this Area
Purchase History
| Date | Buyer | Sale Price | Title Company |
|---|---|---|---|
| Bowen Ray B | -- | North American Title Company | |
| Bowen Ray B | -- | Landsafe Title | |
| Bowen Ray B | $102,000 | Landsafe Title | |
| Federal National Mortgage Association | $225,505 | Landsafe Title | |
| Rodas Jose | $50,000 | Investors Title Company | |
| Ipsen Jens | $11,000 | Chicago Title Co |
Source: Public Records
Mortgage History
| Date | Status | Borrower | Loan Amount |
|---|---|---|---|
| Open | Bowen Ray B | $85,000 |
Source: Public Records
Tax History
| Year | Tax Paid | Tax Assessment Tax Assessment Total Assessment is a certain percentage of the fair market value that is determined by local assessors to be the total taxable value of land and additions on the property. | Land | Improvement |
|---|---|---|---|---|
| 2025 | $1,810 | $131,647 | $32,263 | $99,384 |
| 2024 | $1,810 | $129,067 | $31,631 | $97,436 |
| 2023 | $1,786 | $126,537 | $31,011 | $95,526 |
| 2022 | $1,760 | $124,056 | $30,403 | $93,653 |
| 2021 | $1,717 | $121,624 | $29,807 | $91,817 |
| 2020 | $1,679 | $120,378 | $29,502 | $90,876 |
| 2019 | $1,664 | $118,019 | $28,924 | $89,095 |
| 2018 | $1,614 | $115,706 | $28,357 | $87,349 |
| 2016 | $1,507 | $111,214 | $27,256 | $83,958 |
| 2015 | $1,485 | $109,544 | $26,847 | $82,697 |
| 2014 | $1,488 | $107,400 | $26,322 | $81,078 |
Source: Public Records
Map
Nearby Homes
- 17365 Newmont Ave
- 40629 178th St E
- 40611 178th St E
- 40531 176th St E
- 40976 177th St E
- 17350 Sweetaire Ave
- 40985 174th St E
- 172 172nd St E Unit 6
- 40523 172nd St E
- 0 Cor Coolwater Unit 172nd
- 40719 171st St E
- 41048 173rd St E
- 0 Ave O Vic 172nd Ste Unit 25002458
- 40944 171st St E
- 0 Valeport Avenue Vic 171st Unit 25005256
- 0 175th St E
- 0 179th St E Unit SR25187149
- 41136 174th St E
- 0 172nd St and Mossdale Ave Unit 25008581
- 40226 177th St E
- 40733 176th St E
- 40711 176th St E
- 40734 176th St E
- 40745 176th St E
- 40703 176th St E Unit 1
- 40703 176th St E
- 0 176th St E Near Newmont Ave Unit 21008168
- 40704 176th St E Unit EAST
- 40704 176th St E
- 40742 176th St E
- 0 176th St East Near Newmont Ave Unit 21008169
- 40755 176th St E
- 40752 176th St E
- 40763 176th St E
- 40615 176th St E
- 40614 176th St E
- 40714 174th St E
- 17605 Newmont Ave
- 40658 174th St E
- 17617 Newmont Ave
Your Personal Tour Guide
Ask me questions while you tour the home.