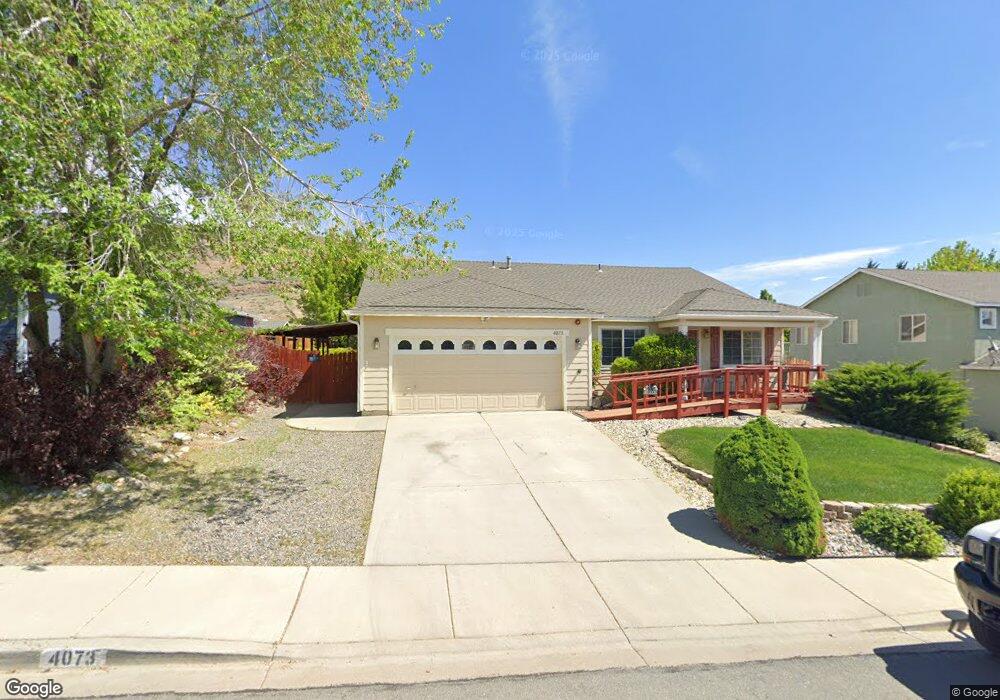
4073 Kings Row Reno, NV 89503
Kings Row NeighborhoodEstimated Value: $655,000 - $714,000
6
Beds
2
Baths
2,364
Sq Ft
$287/Sq Ft
Est. Value
About This Home
This home is located at 4073 Kings Row, Reno, NV 89503 and is currently estimated at $679,417, approximately $287 per square foot. 4073 Kings Row is a home located in Washoe County with nearby schools including Mamie Towles Elementary School, Archie Clayton Pre-AP Academy, and Robert McQueen High School.
Ownership History
Date
Name
Owned For
Owner Type
Purchase Details
Closed on
Apr 22, 2024
Sold by
Sammy And Giebert Valera Family Trust and Valera Sammy
Bought by
Longevity Residential Care Llc
Current Estimated Value
Purchase Details
Closed on
Apr 17, 2024
Sold by
Valera Sammy Dy
Bought by
Sammy And Giebert Valera Family Trust and Valera
Purchase Details
Closed on
Jun 29, 2018
Sold by
Valera Giebert
Bought by
Valera Sammy Dy
Purchase Details
Closed on
Jun 19, 2018
Sold by
Cruz Jennifer T
Bought by
Valera Sammy Dy
Purchase Details
Closed on
Jun 26, 2015
Sold by
Cruz Jennifer T and Villa Jennifer C
Bought by
Cruz Jennifer T
Purchase Details
Closed on
Oct 28, 1999
Sold by
Centex Homes
Bought by
Villa Mario J and Villa Jennifer C
Home Financials for this Owner
Home Financials are based on the most recent Mortgage that was taken out on this home.
Original Mortgage
$124,900
Interest Rate
7.75%
Create a Home Valuation Report for This Property
The Home Valuation Report is an in-depth analysis detailing your home's value as well as a comparison with similar homes in the area
Home Values in the Area
Average Home Value in this Area
Purchase History
| Date | Buyer | Sale Price | Title Company |
|---|---|---|---|
| Longevity Residential Care Llc | -- | None Listed On Document | |
| Sammy And Giebert Valera Family Trust | -- | None Listed On Document | |
| Valera Sammy Dy | $430,000 | First American Title Ins Co | |
| Valera Sammy Dy | $430,000 | First American Title Ins Co | |
| Cruz Jennifer T | -- | First Centennial Reno | |
| Cruz Jennifer T | -- | First Centennial Reno | |
| Villa Mario J | $156,500 | First American Title |
Source: Public Records
Mortgage History
| Date | Status | Borrower | Loan Amount |
|---|---|---|---|
| Previous Owner | Villa Mario J | $124,900 |
Source: Public Records
Tax History Compared to Growth
Tax History
| Year | Tax Paid | Tax Assessment Tax Assessment Total Assessment is a certain percentage of the fair market value that is determined by local assessors to be the total taxable value of land and additions on the property. | Land | Improvement |
|---|---|---|---|---|
| 2025 | $3,570 | $134,924 | $44,835 | $90,089 |
| 2024 | $3,570 | $129,397 | $38,500 | $90,897 |
| 2023 | $3,467 | $126,487 | $40,495 | $85,992 |
| 2022 | $3,368 | $104,313 | $32,760 | $71,553 |
| 2021 | $3,269 | $96,996 | $25,830 | $71,166 |
| 2020 | $3,172 | $98,659 | $27,370 | $71,289 |
| 2019 | $3,080 | $96,989 | $28,140 | $68,849 |
| 2018 | $3,948 | $86,300 | $18,830 | $67,470 |
| 2017 | $3,594 | $85,020 | $17,465 | $67,555 |
| 2016 | $2,829 | $84,097 | $15,400 | $68,697 |
| 2015 | -- | $81,211 | $14,700 | $66,511 |
| 2014 | $2,661 | $76,821 | $12,915 | $63,906 |
| 2013 | -- | $70,348 | $10,640 | $59,708 |
Source: Public Records
Map
Nearby Homes
- 4059 Kings Row
- 3981 Regal Dr
- 5715 W Brookdale Dr
- 3967 Kings Row
- 3996 Buckingham Square
- 2967 Aspendale Dr
- 5554 Tappan Dr
- 2195 Santona Cir
- 3181 Sky Country Dr
- 2210 Altamira Dr
- 5765 Tappan Dr
- 3520 Balboa Dr
- 3435 Balboa Dr
- 3160 Sky Country Dr
- 3201 Green River Dr
- 3235 Bryan St
- 5455 Montego Ct
- 5950 Roxbury Ct
- 5420 Montego Ct
- 5940 Platinum Ridge Ct