Estimated Value: $340,000 - $360,000
4
Beds
3
Baths
1
Sq Ft
$347,219/Sq Ft
Est. Value
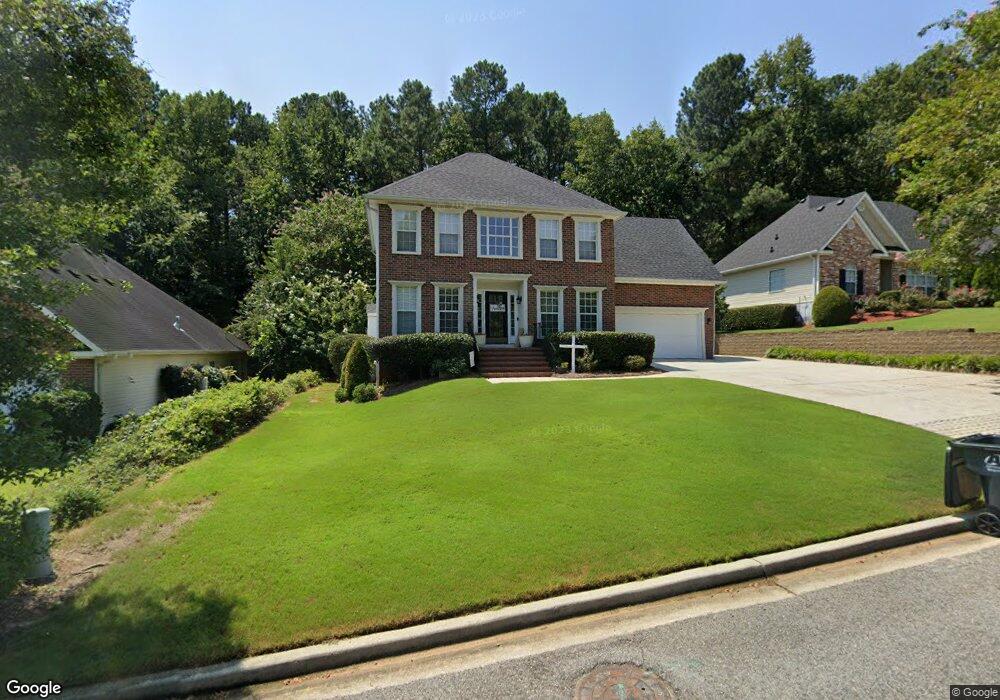
About This Home
This home is located at 4075 Eagle Nest Dr, Evans, GA 30809 and is currently estimated at $347,219, approximately $347,219 per square foot. 4075 Eagle Nest Dr is a home located in Columbia County with nearby schools including River Ridge Elementary School, Riverside Middle School, and Greenbrier High School.
Ownership History
Date
Name
Owned For
Owner Type
Purchase Details
Closed on
Apr 25, 2024
Sold by
Shackelford Christine R
Bought by
Goolsby Kristen Pye and Goolsby Richard Hays
Current Estimated Value
Purchase Details
Closed on
Mar 25, 2021
Sold by
Mcelmurray Christine Renee
Bought by
Shackelford Christine R and Shackelford Jonathan
Home Financials for this Owner
Home Financials are based on the most recent Mortgage that was taken out on this home.
Original Mortgage
$155,000
Interest Rate
2.9%
Mortgage Type
New Conventional
Purchase Details
Closed on
Jul 9, 2012
Sold by
Shank Bill Stephen
Bought by
Mcelmurray Christine Renee
Home Financials for this Owner
Home Financials are based on the most recent Mortgage that was taken out on this home.
Original Mortgage
$161,500
Interest Rate
3.7%
Mortgage Type
New Conventional
Create a Home Valuation Report for This Property
The Home Valuation Report is an in-depth analysis detailing your home's value as well as a comparison with similar homes in the area
Home Values in the Area
Average Home Value in this Area
Purchase History
| Date | Buyer | Sale Price | Title Company |
|---|---|---|---|
| Goolsby Kristen Pye | $335,000 | -- | |
| Shackelford Christine R | -- | -- | |
| Mcelmurray Christine Renee | $170,000 | -- |
Source: Public Records
Mortgage History
| Date | Status | Borrower | Loan Amount |
|---|---|---|---|
| Previous Owner | Shackelford Christine R | $155,000 | |
| Previous Owner | Mcelmurray Christine Renee | $161,500 |
Source: Public Records
Tax History
| Year | Tax Paid | Tax Assessment Tax Assessment Total Assessment is a certain percentage of the fair market value that is determined by local assessors to be the total taxable value of land and additions on the property. | Land | Improvement |
|---|---|---|---|---|
| 2025 | $3,320 | $139,283 | $24,904 | $114,379 |
| 2024 | $3,319 | $132,911 | $23,204 | $109,707 |
| 2023 | $3,319 | $123,414 | $20,104 | $103,310 |
| 2022 | $2,740 | $105,532 | $18,504 | $87,028 |
| 2021 | $2,493 | $91,766 | $15,804 | $75,962 |
| 2020 | $2,434 | $87,715 | $15,404 | $72,311 |
| 2019 | $2,286 | $82,403 | $15,704 | $66,699 |
| 2018 | $2,097 | $75,318 | $13,004 | $62,314 |
| 2017 | $2,025 | $72,474 | $11,804 | $60,670 |
| 2016 | $2,027 | $75,260 | $13,080 | $62,180 |
| 2015 | $2,132 | $79,013 | $12,980 | $66,033 |
| 2014 | $2,011 | $73,602 | $12,580 | $61,022 |
Source: Public Records
Map
Nearby Homes
- 4097 Eagle Nest Dr
- 4099 Eagle Nest Dr
- 958 Hunting Horn Way W
- 4272 Aerie Cir
- 928 Hunting Horn Way W
- 304 Pumphouse Rd
- 915 River Bound Ct
- 1074 Conn Dr
- 1103 Sumter Landing Cir
- 907 Sumter Landing Ct
- 910 Sawbuck Way
- 876 Willow Lake
- 1027 Sluice Gate Dr
- 1085 Conn Dr
- 325 Pump House Rd
- 1208 Sumter Landing Ln
- 1202 Sumter Landing Ln
- 421 Snead Way
- 806 Willow Lake
- 104 Palmer Ct
- 4077 Eagle Nest Dr
- 4073 Eagle Nest Dr
- 4071 Eagle Nest Dr
- 4074 Eagle Nest Dr
- 4167 Eagle Nest Dr
- 4069 Eagle Nest Dr
- 4165 Eagle Nest Dr
- 4163 Eagle Nest Dr
- 4072 Eagle Nest Dr
- 4083 Eagle Nest Dr
- 777 Laurel Springs Ct
- 4084 Eagle Nest Dr
- 4152 Bald Eagle Place
- 4085 Eagle Nest Dr
- 4159 Eagle Nest Dr
- 4157 Eagle Nest Dr
- 773 Laurel Springs Ct
- 771 Laurel Springs Ct
- 4086 Eagle Nest Dr
- 4162 Eagle Nest Dr
Your Personal Tour Guide
Ask me questions while you tour the home.