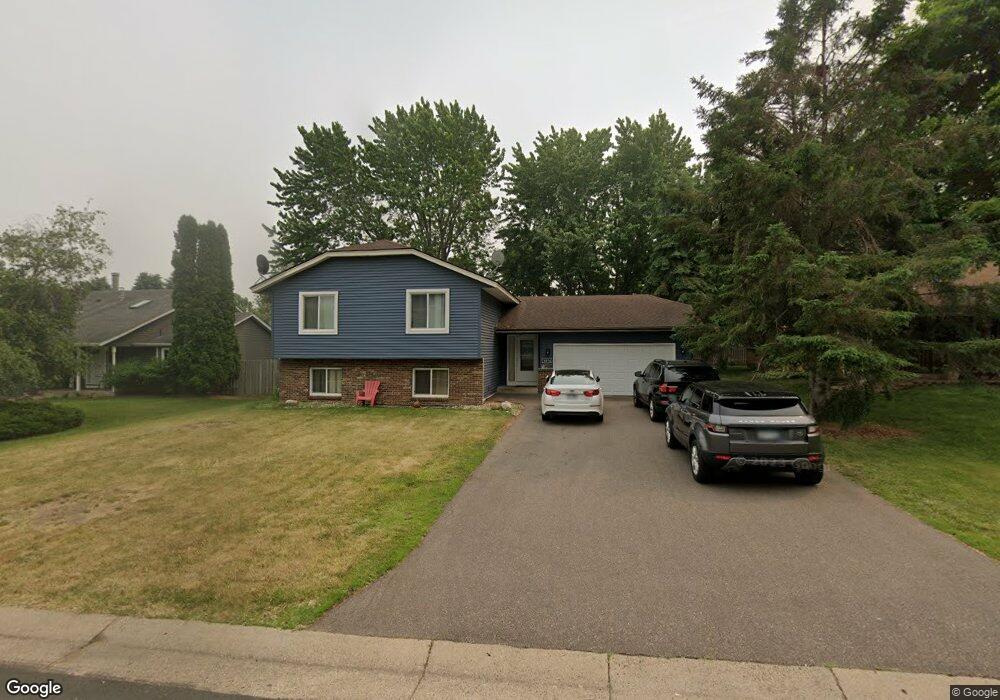
4076 152nd Ct W Rosemount, MN 55068
Estimated Value: $382,562 - $396,000
4
Beds
2
Baths
1,100
Sq Ft
$355/Sq Ft
Est. Value
About This Home
This home is located at 4076 152nd Ct W, Rosemount, MN 55068 and is currently estimated at $390,891, approximately $355 per square foot. 4076 152nd Ct W is a home located in Dakota County with nearby schools including East Lake Elementary School, Rosemount Middle School, and Rosemount Senior High School.
Ownership History
Date
Name
Owned For
Owner Type
Purchase Details
Closed on
Nov 15, 2021
Sold by
Bour Emmanuel
Bought by
Ofori Atta Naana
Current Estimated Value
Home Financials for this Owner
Home Financials are based on the most recent Mortgage that was taken out on this home.
Original Mortgage
$272,690
Outstanding Balance
$250,219
Interest Rate
3.09%
Mortgage Type
FHA
Estimated Equity
$140,672
Purchase Details
Closed on
Jul 27, 2004
Sold by
Coppock James N and Coppock Pamela S
Bought by
Bour Emmanuel
Purchase Details
Closed on
Aug 29, 2000
Sold by
Selves Kevin and Selves Lanette
Bought by
Coppock James N and Coppock Pamela S
Purchase Details
Closed on
Apr 17, 1998
Sold by
Anderson Wilton and Anderson Nancy
Bought by
Anderson Mark E and Anderson Malee
Purchase Details
Closed on
Jun 1, 1997
Sold by
Anderson Wilton and Anderson Nancy
Bought by
Anderson Mark E
Create a Home Valuation Report for This Property
The Home Valuation Report is an in-depth analysis detailing your home's value as well as a comparison with similar homes in the area
Home Values in the Area
Average Home Value in this Area
Purchase History
| Date | Buyer | Sale Price | Title Company |
|---|---|---|---|
| Ofori Atta Naana | -- | Gcs Title | |
| Bour Emmanuel | $234,000 | -- | |
| Coppock James N | $159,900 | -- | |
| Anderson Mark E | $113,400 | -- | |
| Selves Kevin | $117,000 | -- | |
| Anderson Mark E | $113,400 | -- |
Source: Public Records
Mortgage History
| Date | Status | Borrower | Loan Amount |
|---|---|---|---|
| Open | Ofori Atta Naana | $272,690 | |
| Closed | Anderson Mark E | -- |
Source: Public Records
Tax History
| Year | Tax Paid | Tax Assessment Tax Assessment Total Assessment is a certain percentage of the fair market value that is determined by local assessors to be the total taxable value of land and additions on the property. | Land | Improvement |
|---|---|---|---|---|
| 2024 | $4,822 | $339,200 | $92,500 | $246,700 |
| 2023 | $4,822 | $355,400 | $93,500 | $261,900 |
| 2022 | $4,308 | $340,000 | $93,200 | $246,800 |
| 2021 | $4,152 | $291,200 | $81,000 | $210,200 |
| 2020 | $3,988 | $279,100 | $77,200 | $201,900 |
| 2019 | $3,807 | $259,200 | $73,500 | $185,700 |
| 2018 | $3,549 | $242,700 | $70,000 | $172,700 |
| 2017 | $3,382 | $229,600 | $66,700 | $162,900 |
| 2016 | $3,342 | $220,400 | $64,700 | $155,700 |
| 2015 | $3,092 | $198,091 | $57,620 | $140,471 |
| 2014 | -- | $178,580 | $53,664 | $124,916 |
| 2013 | -- | $161,903 | $48,739 | $113,164 |
Source: Public Records
Map
Nearby Homes
- 1620 144th St E
- 4141 154th Ct W
- 15157 Crestone Cir
- 15068 Derby Cir
- 15163 Claret Cir
- 15429 Darling Path
- 4037 156th St W
- 15025 Everleigh Cir
- 3697 152nd St W
- 15684 Crocus Ave W
- 14962 Dodd Blvd Unit 89
- 15493 Dresden Trail
- 3610 156th St W
- 14896 Cimarron Ave W
- 3567 156th St W
- 15720 Cicerone Path
- 15078 Dunwood Trail Unit 33
- 14774 Delmar Ct
- 15057 Dunwood Trail Unit 58
- 15579 Duck Trail Ln
- 4064 152nd Ct W
- 4090 152nd Ct W
- 4079 153rd St W
- 4104 152nd Ct W
- 4050 152nd Ct W
- 4095 153rd St W
- 4059 153rd St W
- 4091 152nd Ct W
- 4075 152nd Ct W
- 4103 153rd St W
- 4120 152nd Ct W
- 4065 152nd Ct W
- 4045 153rd St W
- 4105 152nd Ct W
- 4042 152nd Ct W
- 4051 152nd Ct W
- 4125 153rd St W
- 4119 152nd Ct W
- 4136 4136 152nd-Court-w
- 4035 152nd Ct W
Your Personal Tour Guide
Ask me questions while you tour the home.