
Seller's Agent in 2012
Ed West
RE/MAX Preferred
(800) 536-0171
25 Total Sales
Estimated Value: $611,454
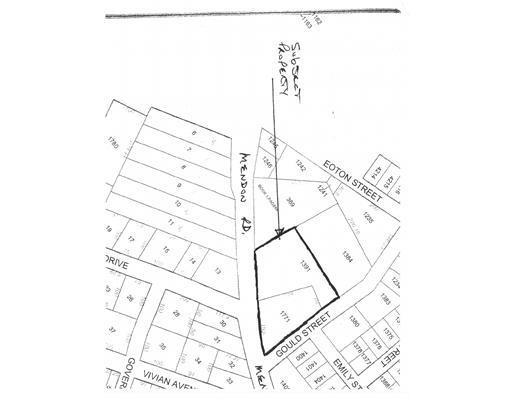
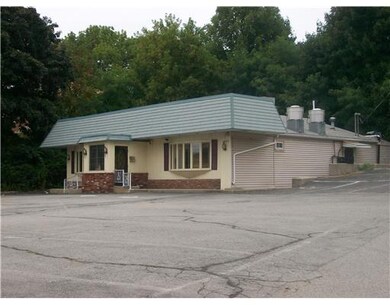
UNIQUE DEVELOPMENT/INVESTOR OPPORTUNITY, 70,000 SF CORNER SITE AT THE INTERSECTION OF RTS. 99 & 122, CUMBERLAND/WOONSOCKET LINE, ABUTTS OFFICE PARK, ADD'L LAND AVAILABLE, CURRENTLY 4 UNIT MULTI AND RESTAURANT.
Last Buyer's Agent
John McFeeley
Weichert Realtors, Hunter Prop
| Date | Buyer | Sale Price | Title Company |
|---|---|---|---|
| Aaa Periquito Properties | $275,000 | -- | |
| Roland A Gagnon Ret 20 | -- | -- | |
| Gagnon Roland | $350,000 | -- |
| Date | Status | Borrower | Loan Amount |
|---|---|---|---|
| Previous Owner | Gagnon Roland | $585,000 |
| Date | Event | Price | List to Sale | Price per Sq Ft |
|---|---|---|---|---|
| 08/03/2012 08/03/12 | Sold | $450,000 | -60.9% | -- |
| 07/04/2012 07/04/12 | Pending | -- | -- | -- |
| 11/01/2011 11/01/11 | For Sale | $1,150,000 | -- | -- |
| Year | Tax Paid | Tax Assessment Tax Assessment Total Assessment is a certain percentage of the fair market value that is determined by local assessors to be the total taxable value of land and additions on the property. | Land | Improvement |
|---|---|---|---|---|
| 2025 | $5,339 | $435,100 | $145,800 | $289,300 |
| 2024 | $5,199 | $435,100 | $145,800 | $289,300 |
| 2023 | $5,056 | $435,100 | $145,800 | $289,300 |
| 2022 | $5,839 | $389,500 | $133,700 | $255,800 |
| 2021 | $5,741 | $389,500 | $133,700 | $255,800 |
| 2020 | $5,578 | $389,500 | $133,700 | $255,800 |
| 2019 | $5,637 | $355,000 | $121,600 | $233,400 |
| 2018 | $705 | $355,000 | $121,600 | $233,400 |
| 2017 | $5,400 | $355,000 | $121,600 | $233,400 |
| 2016 | $4,653 | $272,400 | $117,700 | $154,700 |
| 2015 | $4,653 | $272,400 | $117,700 | $154,700 |
| 2014 | $4,653 | $272,400 | $117,700 | $154,700 |
| 2013 | $4,379 | $277,500 | $116,900 | $160,600 |
Seller's Agent in 2012
Ed West
RE/MAX Preferred
(800) 536-0171
25 Total Sales
J
Buyer's Agent in 2012
John McFeeley
Weichert Realtors, Hunter Prop
Source: State-Wide MLS
MLS Number: 1004716
APN: CUMB-000053-001771-000000
Disclaimer: Certain information contained herein is derived from information provided by parties other than Homes.com. All information provided is deemed reliable, but is not guaranteed to be accurate and should be independently verified.
![]() IDX information is provided exclusively for personal, non-commercial use, and may not be used for any purpose other than to identify prospective properties consumers may be interested in purchasing. Information is deemed reliable but not guaranteed.
IDX information is provided exclusively for personal, non-commercial use, and may not be used for any purpose other than to identify prospective properties consumers may be interested in purchasing. Information is deemed reliable but not guaranteed.
Copyright © 2025 State-Wide MLS, Inc. All rights reserved.