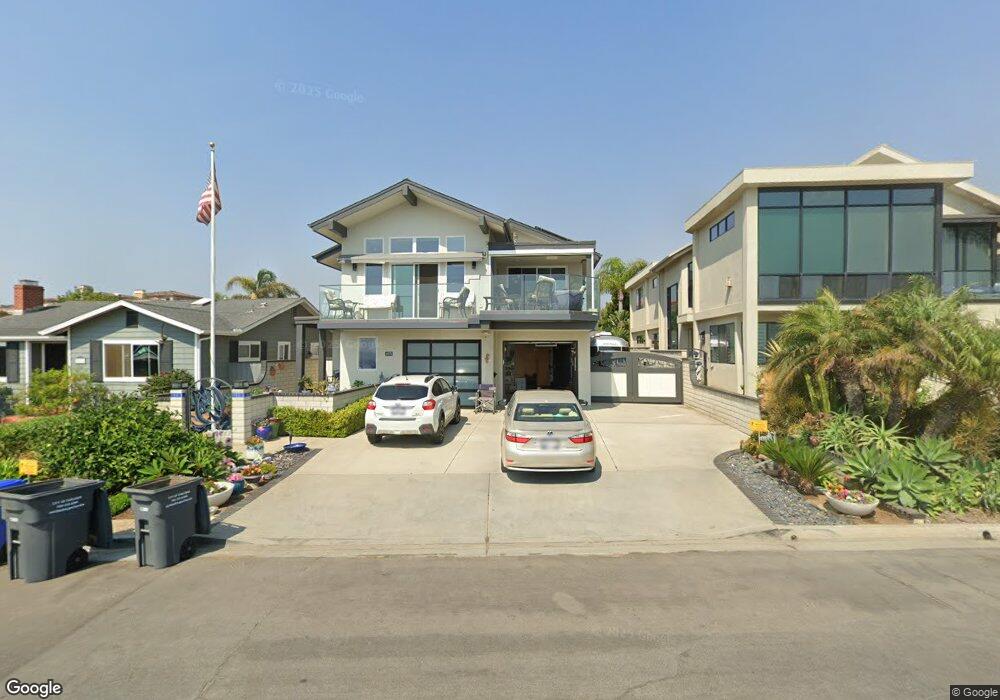
4078 Garfield St Carlsbad, CA 92008
North Beach NeighborhoodEstimated Value: $2,245,000 - $4,911,000
3
Beds
3
Baths
3,634
Sq Ft
$829/Sq Ft
Est. Value
About This Home
This home is located at 4078 Garfield St, Carlsbad, CA 92008 and is currently estimated at $3,013,542, approximately $829 per square foot. 4078 Garfield St is a home located in San Diego County with nearby schools including Carlsbad High School, Sage Creek High, and St. Patrick Catholic School.
Ownership History
Date
Name
Owned For
Owner Type
Purchase Details
Closed on
Nov 5, 2025
Sold by
Meese Family Trust and Schmeiser Robert Gene
Bought by
Schmeiser Robert G and Schmeiser Beth S
Current Estimated Value
Purchase Details
Closed on
Jan 30, 2017
Sold by
Meese Elizabeth J
Bought by
Schmeiser Robert G
Purchase Details
Closed on
Jan 19, 1996
Sold by
Meese George H and Meese Elizabeth J
Bought by
Meese George H and Meese Elizabeth J
Purchase Details
Closed on
Dec 13, 1995
Sold by
Meese George Henry
Bought by
Meese George H and Meese Elizabeth J
Create a Home Valuation Report for This Property
The Home Valuation Report is an in-depth analysis detailing your home's value as well as a comparison with similar homes in the area
Home Values in the Area
Average Home Value in this Area
Purchase History
| Date | Buyer | Sale Price | Title Company |
|---|---|---|---|
| Schmeiser Robert G | -- | None Available | |
| Meese George H | -- | -- | |
| Meese George H | -- | -- | |
| Meese George H | -- | -- |
Source: Public Records
Tax History Compared to Growth
Tax History
| Year | Tax Paid | Tax Assessment Tax Assessment Total Assessment is a certain percentage of the fair market value that is determined by local assessors to be the total taxable value of land and additions on the property. | Land | Improvement |
|---|---|---|---|---|
| 2025 | $6,454 | $617,839 | $93,587 | $524,252 |
| 2024 | $6,454 | $605,725 | $91,752 | $513,973 |
| 2023 | $6,314 | $584,045 | $89,953 | $494,092 |
| 2022 | $6,216 | $572,594 | $88,190 | $484,404 |
| 2021 | $6,168 | $561,367 | $86,461 | $474,906 |
| 2020 | $6,126 | $555,612 | $85,575 | $470,037 |
| 2019 | $6,015 | $544,719 | $83,898 | $460,821 |
| 2018 | $5,761 | $534,039 | $82,253 | $451,786 |
| 2017 | $5,665 | $523,569 | $80,641 | $442,928 |
| 2016 | $5,437 | $513,304 | $79,060 | $434,244 |
| 2015 | $5,414 | $505,595 | $77,873 | $427,722 |
| 2014 | $5,324 | $495,692 | $76,348 | $419,344 |
Source: Public Records
Map
Nearby Homes
- 334 Date Ave
- 312 Chinquapin Ave
- 314 Chinquapin Ave
- 320 Chinquapin Ave
- 324 Chinquapin Ave
- 4007 Canario St Unit E
- 4009 Canario St Unit H
- 111 Sequoia Ave Unit C
- 370 Tamarack Ave
- 801 Kalpati Cir Unit B
- 4020 Layang Cir Unit C
- 817 Kalpati Cir Unit 212
- 368 Hemlock Ave
- 832 Kalpati Cir Unit E
- 160 Hemlock Ave
- 385 Juniper Ave
- 256 Juniper Ave Unit B6
- 141 Cherry Ave
- Cherry Beach Homes Plan at Cherry Beach Homes - Cherry Beach homes
- 164 Cherry Ave