408 13th St Farmington, MN 55024
Estimated Value: $331,000 - $363,248
4
Beds
2
Baths
981
Sq Ft
$357/Sq Ft
Est. Value
About This Home
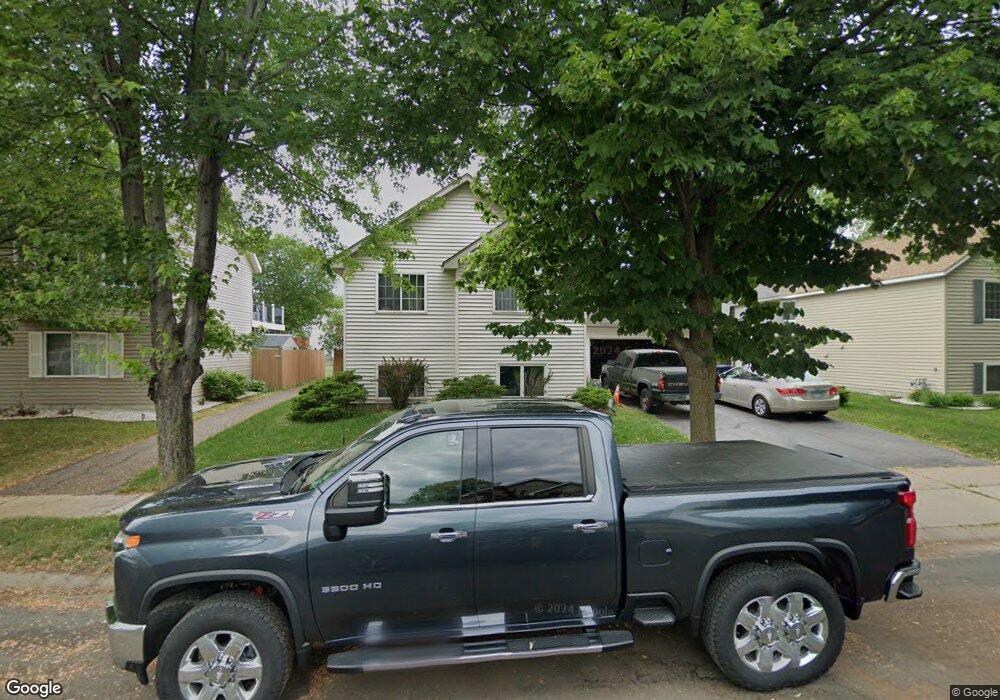
This home is located at 408 13th St, Farmington, MN 55024 and is currently estimated at $350,312, approximately $357 per square foot. 408 13th St is a home located in Dakota County with nearby schools including Farmington Elementary School, Robert Boeckman Middle School, and Farmington High School.
Ownership History
Date
Name
Owned For
Owner Type
Purchase Details
Closed on
Dec 4, 1998
Sold by
Sienna Corp
Bought by
M W Johnson Construction Inc
Current Estimated Value
Purchase Details
Closed on
Jul 9, 1998
Sold by
Brandl/Anderson Homes Inc
Bought by
Cheney Jon R and Cheney Tamara J
Purchase Details
Closed on
Apr 3, 1998
Sold by
Sienna Corp
Bought by
Brandl/Anderson Homes Inc
Create a Home Valuation Report for This Property
The Home Valuation Report is an in-depth analysis detailing your home's value as well as a comparison with similar homes in the area
Home Values in the Area
Average Home Value in this Area
Purchase History
| Date | Buyer | Sale Price | Title Company |
|---|---|---|---|
| M W Johnson Construction Inc | $34,900 | -- | |
| Cheney Jon R | $134,007 | -- | |
| Brandl/Anderson Homes Inc | $33,900 | -- |
Source: Public Records
Mortgage History
| Date | Status | Borrower | Loan Amount |
|---|---|---|---|
| Closed | M W Johnson Construction Inc | -- |
Source: Public Records
Tax History Compared to Growth
Tax History
| Year | Tax Paid | Tax Assessment Tax Assessment Total Assessment is a certain percentage of the fair market value that is determined by local assessors to be the total taxable value of land and additions on the property. | Land | Improvement |
|---|---|---|---|---|
| 2024 | $3,716 | $314,800 | $78,500 | $236,300 |
| 2023 | $3,716 | $312,800 | $78,700 | $234,100 |
| 2022 | $3,594 | $303,300 | $78,400 | $224,900 |
| 2021 | $3,366 | $263,600 | $68,200 | $195,400 |
| 2020 | $3,356 | $246,900 | $65,000 | $181,900 |
| 2019 | $3,191 | $237,600 | $62,000 | $175,600 |
| 2018 | $3,020 | $223,400 | $59,100 | $164,300 |
| 2017 | $2,907 | $207,300 | $56,200 | $151,100 |
| 2016 | $2,812 | $195,500 | $53,500 | $142,000 |
| 2015 | $2,459 | $164,846 | $45,968 | $118,878 |
| 2014 | -- | $152,311 | $40,552 | $111,759 |
| 2013 | -- | $132,146 | $35,375 | $96,771 |
Source: Public Records
Map
Nearby Homes