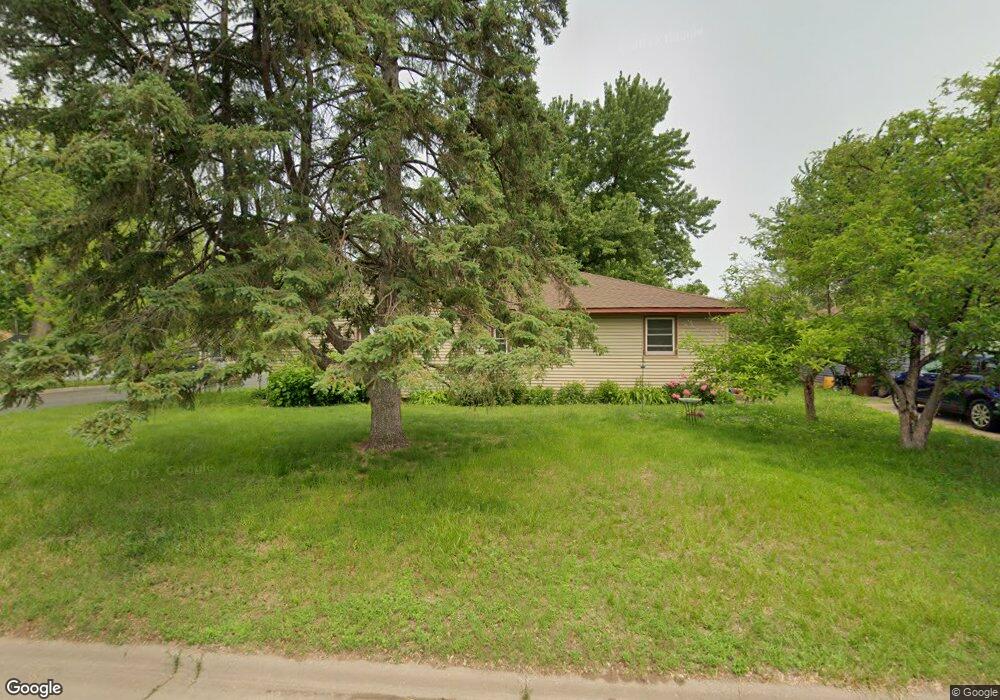
408 18th St W Hastings, MN 55033
Hastings-Marshan Township NeighborhoodEstimated Value: $314,000 - $344,000
4
Beds
2
Baths
1,648
Sq Ft
$199/Sq Ft
Est. Value
About This Home
This home is located at 408 18th St W, Hastings, MN 55033 and is currently estimated at $327,883, approximately $198 per square foot. 408 18th St W is a home located in Dakota County with nearby schools including Pinecrest Elementary School, Hastings Middle School, and Hastings High School.
Ownership History
Date
Name
Owned For
Owner Type
Purchase Details
Closed on
Jul 2, 2016
Sold by
Kenyon David A
Bought by
Kenyon Lauri J
Current Estimated Value
Purchase Details
Closed on
May 23, 2002
Sold by
Wild Cherries Invest
Bought by
Kenyon Lauri and Kenyon David
Purchase Details
Closed on
Sep 23, 1996
Sold by
Fultz Carl J and Fultz Melissa M
Bought by
Schmit Whitley Patricia
Create a Home Valuation Report for This Property
The Home Valuation Report is an in-depth analysis detailing your home's value as well as a comparison with similar homes in the area
Home Values in the Area
Average Home Value in this Area
Purchase History
| Date | Buyer | Sale Price | Title Company |
|---|---|---|---|
| Kenyon Lauri J | -- | None Available | |
| Kenyon Lauri | $150,000 | -- | |
| Wild Cherries Investments Inc | $150,000 | -- | |
| Kenyon David A | $150,000 | -- | |
| Schmit Whitley Patricia | $97,000 | -- |
Source: Public Records
Mortgage History
| Date | Status | Borrower | Loan Amount |
|---|---|---|---|
| Closed | Kenyon David A | -- |
Source: Public Records
Tax History Compared to Growth
Tax History
| Year | Tax Paid | Tax Assessment Tax Assessment Total Assessment is a certain percentage of the fair market value that is determined by local assessors to be the total taxable value of land and additions on the property. | Land | Improvement |
|---|---|---|---|---|
| 2024 | $3,746 | $323,300 | $67,000 | $256,300 |
| 2023 | $3,746 | $330,500 | $67,100 | $263,400 |
| 2022 | $3,180 | $313,800 | $66,900 | $246,900 |
| 2021 | $3,130 | $258,000 | $58,200 | $199,800 |
| 2020 | $3,016 | $252,200 | $55,400 | $196,800 |
| 2019 | $2,886 | $236,100 | $50,100 | $186,000 |
| 2018 | $2,695 | $216,100 | $47,700 | $168,400 |
| 2017 | $2,563 | $196,700 | $45,500 | $151,200 |
| 2016 | $2,519 | $187,200 | $42,500 | $144,700 |
| 2015 | $2,365 | $158,851 | $36,379 | $122,472 |
| 2014 | -- | $148,714 | $34,607 | $114,107 |
| 2013 | -- | $127,023 | $30,260 | $96,763 |
Source: Public Records
Map
Nearby Homes