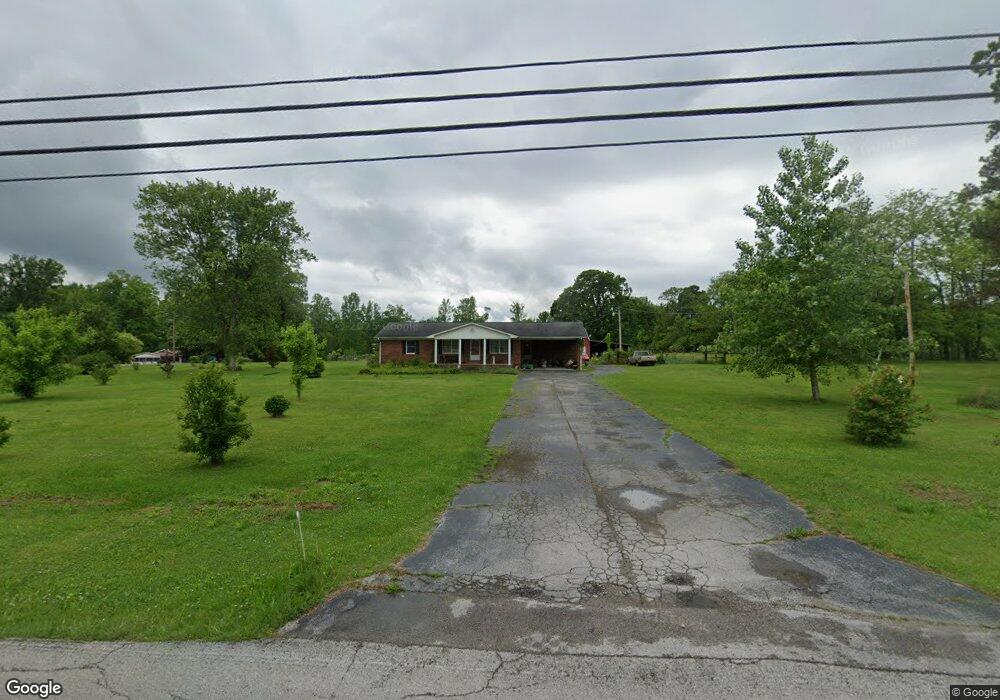
408 1st Ave N Baxter, TN 38544
Estimated Value: $267,000 - $362,000
--
Bed
1
Bath
1,504
Sq Ft
$199/Sq Ft
Est. Value
About This Home
This home is located at 408 1st Ave N, Baxter, TN 38544 and is currently estimated at $300,026, approximately $199 per square foot. 408 1st Ave N is a home located in Putnam County with nearby schools including Baxter Primary School, Cornerstone Elementary School, and Upperman Middle School.
Ownership History
Date
Name
Owned For
Owner Type
Purchase Details
Closed on
Aug 15, 2017
Sold by
Bradley Earnest
Bought by
Herren Mark S
Current Estimated Value
Home Financials for this Owner
Home Financials are based on the most recent Mortgage that was taken out on this home.
Original Mortgage
$162,816
Outstanding Balance
$135,857
Interest Rate
3.96%
Mortgage Type
VA
Estimated Equity
$164,169
Purchase Details
Closed on
Mar 31, 2006
Sold by
Eugene Haggard and Nell Mary
Bought by
Bradley Earnest and Joa Christie
Home Financials for this Owner
Home Financials are based on the most recent Mortgage that was taken out on this home.
Original Mortgage
$98,400
Interest Rate
6.2%
Purchase Details
Closed on
Jul 25, 2005
Sold by
Allen Ronald M
Bought by
Eugene Haggard and Nell Mary
Home Financials for this Owner
Home Financials are based on the most recent Mortgage that was taken out on this home.
Original Mortgage
$75,000
Interest Rate
5.51%
Purchase Details
Closed on
Aug 30, 1984
Bought by
Judd Hobert E and Judd Opal
Purchase Details
Closed on
Oct 6, 1975
Create a Home Valuation Report for This Property
The Home Valuation Report is an in-depth analysis detailing your home's value as well as a comparison with similar homes in the area
Home Values in the Area
Average Home Value in this Area
Purchase History
| Date | Buyer | Sale Price | Title Company |
|---|---|---|---|
| Herren Mark S | $159,000 | -- | |
| Bradley Earnest | $123,000 | -- | |
| Eugene Haggard | $110,000 | -- | |
| Judd Hobert E | -- | -- | |
| -- | -- | -- |
Source: Public Records
Mortgage History
| Date | Status | Borrower | Loan Amount |
|---|---|---|---|
| Open | Herren Mark S | $162,816 | |
| Previous Owner | Not Available | $98,400 | |
| Previous Owner | Not Available | $75,000 |
Source: Public Records
Tax History Compared to Growth
Tax History
| Year | Tax Paid | Tax Assessment Tax Assessment Total Assessment is a certain percentage of the fair market value that is determined by local assessors to be the total taxable value of land and additions on the property. | Land | Improvement |
|---|---|---|---|---|
| 2024 | $1,151 | $43,275 | $10,250 | $33,025 |
| 2023 | $1,151 | $43,275 | $10,250 | $33,025 |
| 2022 | $1,070 | $43,275 | $10,250 | $33,025 |
| 2021 | $1,523 | $43,275 | $10,250 | $33,025 |
| 2020 | $1,488 | $42,800 | $10,250 | $32,550 |
| 2019 | $1,488 | $34,475 | $10,250 | $24,225 |
| 2018 | $1,420 | $34,475 | $10,250 | $24,225 |
| 2017 | $1,420 | $34,475 | $10,250 | $24,225 |
| 2016 | $1,420 | $34,475 | $10,250 | $24,225 |
| 2015 | $1,420 | $34,475 | $10,250 | $24,225 |
| 2014 | $1,385 | $31,873 | $0 | $0 |
Source: Public Records
Map
Nearby Homes
- 396 1st Ave N
- 407 1st Ave N
- 411 1st Ave N
- 390 1st Ave N
- 168 W Chestnut St
- 412 1st Ave N
- 415 1st Ave N
- 399 1st Ave N
- 386 1st Ave N
- 417 1st Ave N
- 389 1st Ave N
- 382 1st Ave N
- 419 1st Ave N
- 107 Chestnut St
- 381 1st Ave N
- 113 Chestnut St
- 356 1st Ave N Unit 378
- 20 AC 1st Ave N
- 22 AC 1st Ave N
- 119 Chestnut St