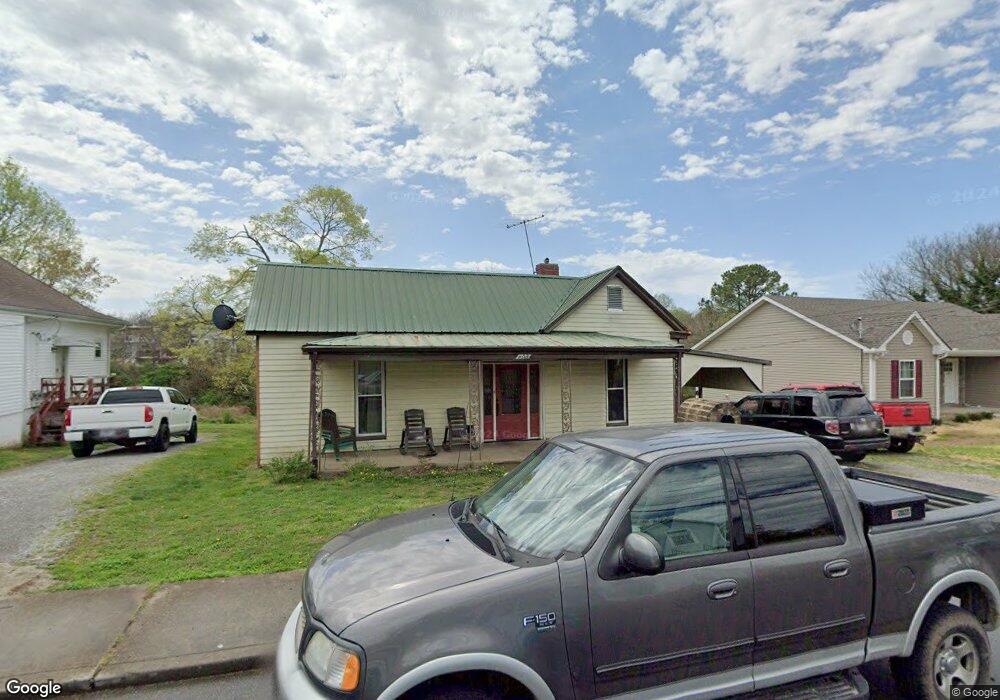
408 7th Ave W Springfield, TN 37172
Estimated Value: $132,000 - $208,000
Studio
1
Bath
928
Sq Ft
$173/Sq Ft
Est. Value
About This Home
This home is located at 408 7th Ave W, Springfield, TN 37172 and is currently estimated at $160,141, approximately $172 per square foot. 408 7th Ave W is a home located in Robertson County with nearby schools including Cheatham Park Elementary School, Westside Elementary School, and Innovation Academy.
Ownership History
Date
Name
Owned For
Owner Type
Purchase Details
Closed on
Jul 9, 2015
Sold by
Hall J Christopher
Bought by
Trevino Jacinto C
Current Estimated Value
Purchase Details
Closed on
Apr 16, 1998
Sold by
Wisener John Paul
Bought by
Hall James H and Hall Margie H
Home Financials for this Owner
Home Financials are based on the most recent Mortgage that was taken out on this home.
Original Mortgage
$30,870
Interest Rate
7.03%
Purchase Details
Closed on
Aug 22, 1991
Bought by
Wisener John Paul and Dorothy Gayle
Purchase Details
Closed on
Nov 17, 1979
Bought by
Wotier Nellie
Purchase Details
Closed on
Nov 1, 1955
Create a Home Valuation Report for This Property
The Home Valuation Report is an in-depth analysis detailing your home's value as well as a comparison with similar homes in the area
Home Values in the Area
Average Home Value in this Area
Purchase History
| Date | Buyer | Sale Price | Title Company |
|---|---|---|---|
| Trevino Jacinto C | $40,000 | -- | |
| Hall James H | $30,000 | -- | |
| Wisener John Paul | $20,800 | -- | |
| Wotier Nellie | -- | -- | |
| -- | -- | -- |
Source: Public Records
Mortgage History
| Date | Status | Borrower | Loan Amount |
|---|---|---|---|
| Previous Owner | Not Available | $30,870 |
Source: Public Records
Tax History
| Year | Tax Paid | Tax Assessment Tax Assessment Total Assessment is a certain percentage of the fair market value that is determined by local assessors to be the total taxable value of land and additions on the property. | Land | Improvement |
|---|---|---|---|---|
| 2025 | -- | $31,450 | $9,375 | $22,075 |
| 2024 | -- | $31,450 | $9,375 | $22,075 |
| 2023 | $788 | $31,450 | $9,375 | $22,075 |
| 2022 | $480 | $13,175 | $2,750 | $10,425 |
| 2021 | $480 | $13,175 | $2,750 | $10,425 |
| 2020 | $480 | $13,175 | $2,750 | $10,425 |
| 2019 | $14,439 | $13,175 | $2,750 | $10,425 |
| 2018 | $480 | $13,175 | $2,750 | $10,425 |
| 2017 | $480 | $11,200 | $2,600 | $8,600 |
| 2016 | $480 | $11,200 | $2,600 | $8,600 |
| 2015 | $466 | $11,200 | $2,600 | $8,600 |
| 2014 | -- | $11,200 | $2,600 | $8,600 |
Source: Public Records
Map
Nearby Homes
Your Personal Tour Guide
Ask me questions while you tour the home.